
🚀 Highlights
Study knowledge stays with the project: The new Insight Repository stores PDF, PowerPoint, Excel and Word documents directly inside a project. Admins add a title, description and tags under Documents; project viewers see and download the same collection through their existing access profiles. Successful PowerPoint, PDF and Excel report exports are archived automatically with export tags and a timestamp.
Projects as portable bundles: A complete project can now be exported under Admin → Projects as a documented ZIP bundle and imported on the same or another DataLion instance. Settings, codebook, reports and tabs, saved filters including weights, translations, custom labels, theme, color scheme, datasets and media files all travel with it. Users, permissions, invitations, share links, auto-import credentials and linked surveys are deliberately not part of a bundle.
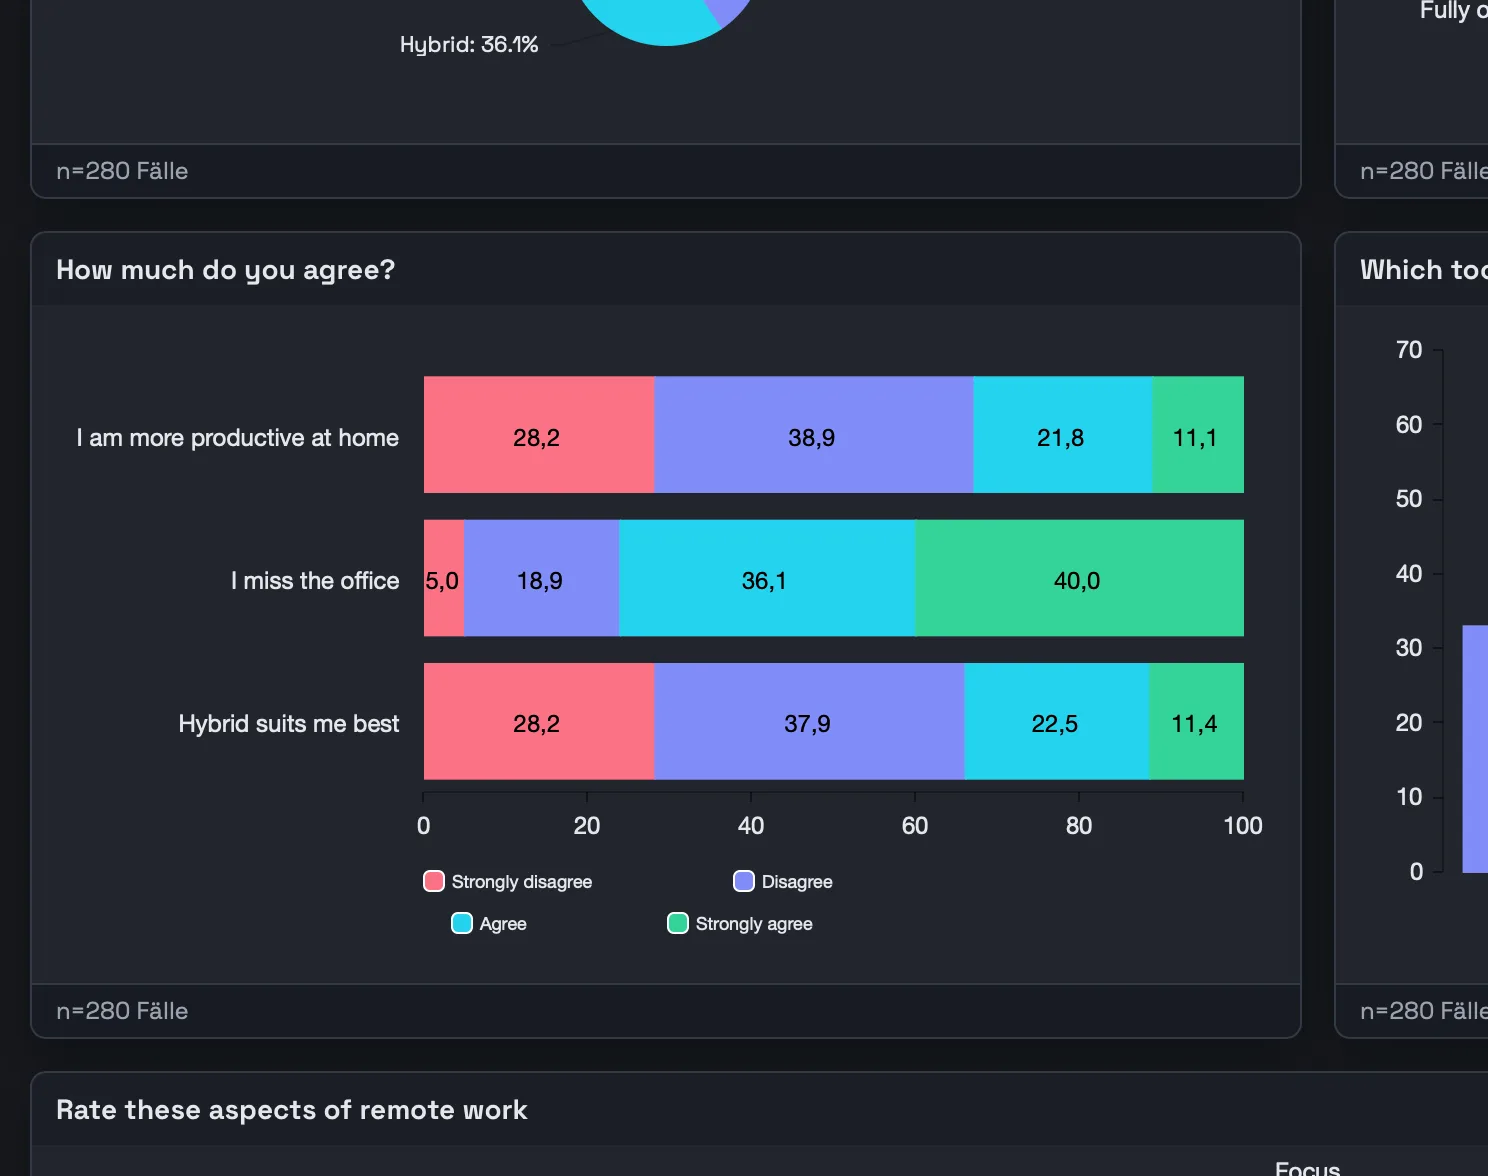
A public study gallery, including the data: In our new gallery, you can open and filter finished dashboards without an account and download the underlying dataset as CSV. Every study is clearly marked as synthetic or open data. Nobody was surveyed for the synthetic examples, and no customer data is used. The two open-data studies, “Germany by region” and “Digital Europe,” use published Eurostat statistics under CC BY 4.0 and show their sources on the page. In short, you can now try the real thing instead of only looking at screenshots.
Bring Tableau workbooks into DataLion: Upload a .twb or .twbx file under Admin → Import Tableau workbook, or drop a .twbx on the start screen. DataLion imports the data embedded in the workbook, builds data tables and a codebook, and recreates Tableau dashboards as report tabs. KPI cards, timelines, bar, column and stacked charts, heatmaps, scatter plots, histograms, waterfalls and gauges are carried over wherever possible. An import report shows which sheets were carried over completely, approximated or skipped. Live connections without embedded data, legacy .tde files and complex workbooks with multiple data sources remain visible as limitations.
✨ What's New
📋 32 survey answer types plus description blocks: DataLion surveys now also offer semantic differentials, swipe cards, map markers, Kano, Van Westendorp price sensitivity, A/B tests, IAT tasks, private file uploads and generated follow-up questions. The new types work from questionnaire creation and completion through to the results dataset. The Other option with free text works end to end through export. AI-generated follow-ups use the AI model configured by the administrator.
📱 Build surveys on a phone: On smaller screens, the questionnaire remains easy to navigate. Questions, new elements, settings and sharing are available from a fixed mobile menu, and questions can be reordered reliably by touch.
🏖️ Holiday Concept Lab: A new bilingual template combines an upload, concept ratings, an association task, swipe cards, a destination map, Kano, price sensitivity, randomized message tests and a generated follow-up in one complete concept study. Every survey template now also starts with a fitting design and, where appropriate, a conversational one-question-at-a-time presentation.
📊 More chart controls: New options include clustered columns for comparisons such as actual versus budget, a mean-across-items line for polarity and radar charts, configurable choropleth heat colors, and forecast confidence bands at 80, 90, 95 or 99 percent for timelines. KPI charts now honor the configured unit format as well.
🌙 Dark mode for the back office: Each user can choose System, Light or Dark from the account menu. The preference only changes DataLion's administration interface; branded dashboard and report themes remain untouched.
🇪🇸 Spanish and Italian: Both languages are now available throughout DataLion, including registration, billing, administration, charts, exports and BI vocabulary with locale-aware number formatting.
📈 Improvements
🗂️ Report editor as a settings page: Roughly 30 options are now organized into General, Access, Sharing, Tabs, Behaviour, Export and Advanced, with section navigation, explanatory choice cards and an always-visible save bar.
↔️ Readable report tabs: Large tab sets keep their natural label width in a horizontally scrollable strip. Edge fades signal hidden content, the active tab is centered and its management menu stays fully visible.
⚡ Fewer page reloads: Renaming a tab, saving a dashboard, editing a title or subtitle, and bookmark actions now update the current page in place and show a brief confirmation.
🎨 Calmer table heatmaps: Scale colors are tinted toward the card surface, while dark cells automatically use readable light text. The same rendering carries into PDF exports, and values remain easy to read even at the ends of the scale.
🔢 KPI tiles use their space: Values now scale with the widget, long numbers no longer clip and lower-priority supporting rows yield first when space gets tight.
🧭 Understandable chart errors: Report readers now see a plain-language explanation and a fix hint instead of an internal error message. Administrators can expand additional technical details when needed.
💶 Smarter data imports: CSV columns that mix integer- and decimal-formatted monetary amounts are recognized as numeric measures. Very wide multiple-response files can be imported again, with numbered 0/1 columns combined automatically into one multiple-choice question. The SPSS import wizard works again and preserves data, variable labels and value labels from
.savfiles.
🔐 Security
2026.2.193 protects access between workspaces and projects more consistently: export links expire automatically and permissions for integrations are checked reliably. Login, 2FA, password reset and signup are better protected against automated attempts, while file and data imports are checked more strictly.
🐛 Important Bug Fixes
- Weighted charts: Charts with filter-driven weights load correctly again.
- Data tables: Data tables display reliably again.
- Saved layouts: A newly saved layout reliably replaces an older local browser copy.
- Date picker: After a change, the button shows the range and preset you just selected.
- Waterfall colors: Positive and negative bars once again use their per-chart configured colors.
- Incompatible chart types: Instead of an empty chart or technical error, DataLion explains when data is missing or a chart needs more variables.
Enjoy DataLion 2026.2.193. As always, we would love to hear what you think, and which older project you will put into a portable bundle first.