
In short: Ask about twenty features one by one and you get "important" twenty times. MaxDiff forces a choice: in each set respondents pick the most and the least important feature, and the sets produce a ranking with real distances, per plan and role. This article covers the four design rules, the sample, the analysis and the way the ranking gets into the roadmap meeting.
Straight to the template: MaxDiff feature prioritisation as an online template with choice sets in the questionnaire. When MaxDiff and when conjoint is the right method is covered in MaxDiff vs. Conjoint; the result of a real experiment is in the gallery.
Why importance scales do not produce a roadmap
The feature survey before quarterly planning looks the same in most product teams: a list of features, and for each a scale from "unimportant" to "very important". The result is a list of means between 3.8 and 4.4, and the ranking within it is noise, because nobody gives "unimportant" to a feature they might need once.
Importance scales measure no trade-offs, and product decisions are trade-offs. The team can build three features a quarter, not twenty, and it wants to know which three users would choose if they had to choose. That is exactly what MaxDiff measures.
How MaxDiff works
Respondents see sets of four or five features one after another and pick the most and the least important in each set. The sets are composed so that every feature appears several times per respondent, in changing company. From many sets per respondent and many respondents a score emerges for each feature: how often it was chosen as most important, minus how often as least important, or as a utility from a logit model.
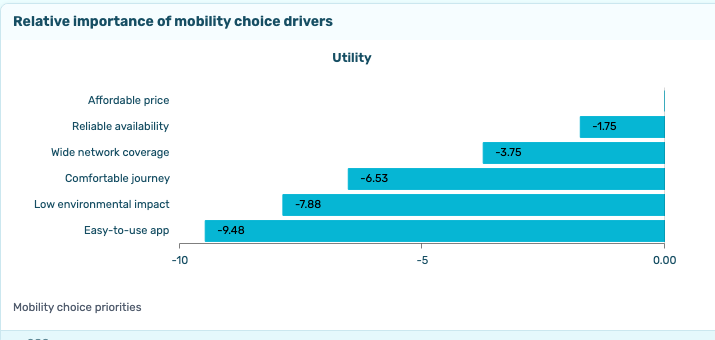
The result is a ranking with distances. Feature A is not "more important" than B; it was chosen as most important twice as often and as least important half as often. And because respondents had to decide in every set, there is no list of nothing but "very important".
Four design rules
- Eight to 25 items. Below eight the effort is not worth it; an importance scale is enough then. Above 25 the questionnaire gets too long and the items too similar, and respondents start guessing.
- Four to five items per set, each item three to five times per respondent. With twelve items and four per set that is nine to twelve sets, about three minutes. More sets per respondent give more stable values; from about 15 sets care declines.
- Items at the same level. "Dark mode" next to "better performance" compares an apple with a fruit basket. Word items as concrete, comparable user outcomes: "receive reports automatically by email every Monday" rather than "automation".
- Settle the question before building the sets. "Which feature is most important to you?" measures importance for the roadmap. "Which would you most likely use?" measures intention to use. "Which would most likely make you switch?" measures positioning. All three are legitimate, no two are the same.
Have the items read by two people outside the team. An item only the team understands gets chosen at random in the sets and lands in the middle of the ranking, where it says nothing.
Sample and segments
An overall ranking becomes stable, in our experience, from about 150 respondents. Whoever needs the ranking per segment should reach 100 per segment; with three plans that is 300 respondents. Differences between segments are often smaller than expected, and whoever wants to report them checks them with a significance test.
Plan and role do not need to be asked for. Your app knows them and appends them as URL parameters to the survey link, for example ?plan=team&role=admin; the questionnaire stays at the sets. Invite active users, not sign-ups: whoever does not use the product has no opinion on features that reflects trade-offs.
Analysis: reading the ranking
The analysis delivers three views that should be read together.
- The preference ranking as bars per feature, with the distances. The gap between third and fourth place is often the most important piece of information: if it is large, the top three are the roadmap; if it is small, the team has to decide itself.
- The best-worst table with the share as most important and the share as least important per feature. A feature chosen often as most important and often as least important polarises; it is decisive for one segment and irrelevant for another, and the ranking alone does not show that.
- The ranking per segment as a comparison: what admins want, what users want, what the Enterprise plan weights differently from the Team plan. Here the differences are usually worth the roadmap discussion, not the overall ranking.
Place the MaxDiff ranking next to the coded open answers from the microsurvey ("What do you miss most?"). Where both agree, the decision is undisputed. Where they diverge, users know something the items did not capture, and the next MaxDiff has one item more.
What MaxDiff does not say
MaxDiff delivers a ranking of importance. It does not say whether a feature may be missing. A must-have whose absence annoys can sit at the back of the ranking because it is taken for granted; a delighter can sit at the front because it is new. For that distinction there is the Kano model, which has every feature rated twice, once included and once missing. And MaxDiff says nothing about prices; for that, Van Westendorp and conjoint analysis are available.
In DataLion
The MaxDiff question type renders the choice sets in the questionnaire and computes scores, best-worst shares and utilities from an aggregate logit model in the dashboard, filterable by plan and role. Individual utilities via hierarchical Bayes DataLion does not compute; for the roadmap question of which five features lead and whether the Team plan chooses differently from the Enterprise plan, the aggregate model is enough. Whoever needs HB exports the data and computes externally.
Next step
Word twelve to 16 feature items at the same level, have them read, and open the MaxDiff template. Append plan and role as parameters, invite active users and aim for 150 responses. The ranking with distances then sits in the dashboard, and the roadmap meeting has a basis with real distances instead of a column of "very important". The full picture for product teams is on the page UX research and product research.