
Referring Physician Survey
The survey of referring practices: reachability, discharge letter, discharge management and recommendation – analysable by specialty, referral frequency and distance to the hospital.
The live demo opens the real questionnaire — no signup required.
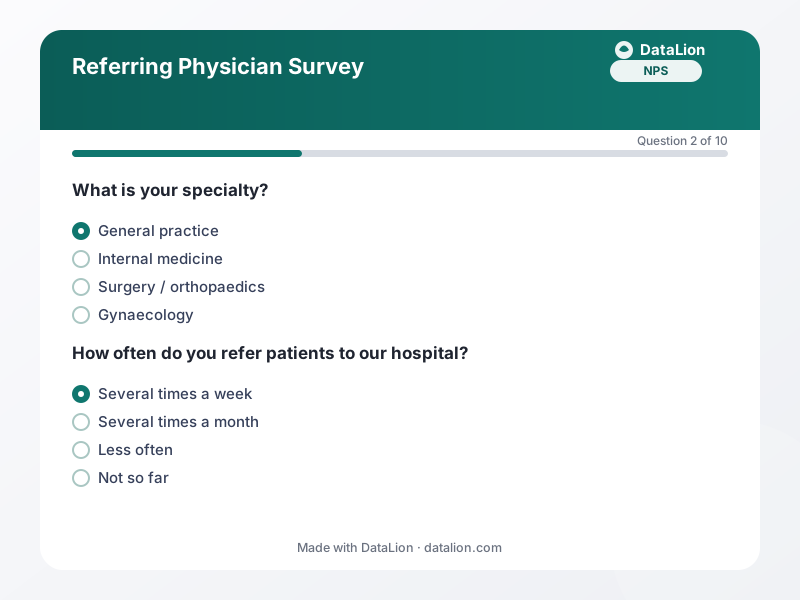
Referring practices decide a large share of a hospital's admissions, and yet few hospitals ask them systematically. When they do, the survey often ends in a mean of 3.9 that nobody can act on. This template therefore separates satisfaction from importance: an aspect that is unimportant and rated poorly is not a problem. An aspect that is very important and rated average is one. The structural questions (specialty, referral frequency, distance) make the results filterable, and a URL parameter per department tells you which team writes the fast discharge letter and which the slow one.
When should you use this template?
This template is a great fit for:
- Once a year to every referring practice in the catchment area
- As a baseline before launching a referrer portal or digital results delivery
- After restructuring departments or a change of chief physician
- Via link in the referrer newsletter or by letter with a QR code
Every question in this template
- 1Single choice
What is your specialty? *
- General practice
- Internal medicine
- Surgery / orthopaedics
- Gynaecology
- Paediatrics
- Neurology / psychiatry
- 2Single choice
How often do you refer patients to our hospital? *
- Several times a week
- Several times a month
- Less often
- Not so far
- 3Matrix
How satisfied are you with the following aspects of the collaboration?
Very dissatisfied Dissatisfied Neutral Satisfied Very satisfied Reachability of departments by phone Appointment scheduling for your patients Speed of the discharge letter Quality of the discharge letter's content Feedback on complications or changed findings - 4Matrix
How important are these aspects to you for the collaboration?
Unimportant Less important Important Very important Reachability of departments by phone Appointment scheduling for your patients Speed of the discharge letter Quality of the discharge letter's content Feedback on complications or changed findings - 5Rating
How do you rate the medical quality of our hospital overall? *
- 6Multiple choice
Which channels do you prefer for communicating with us?
Multiple answers possible.
- Phone with direct extension
- Fax
- Secure email
- Referrer portal
- In-person exchange and case discussions
- 7Single choice
In the last twelve months, have you deliberately referred patients to another hospital although we could have treated them?
- Yes, frequently
- Yes, occasionally
- No
- 8NPS (0–10)
How likely are you to recommend our hospital to a colleague? *
- 9Long text
What should we improve first in the collaboration?
- 10Single choice
How far is your practice from our hospital?
- Up to 10 km
- 10 to 30 km
- More than 30 km
From questionnaire to dashboard
The questionnaire produces a dashboard for hospital management and the chief physicians:
- Satisfaction per department: The crosstab of rating aspects against department as a heatmap: which department slips on the discharge letter, which on discharge management.
- Importance against satisfaction: Each aspect as a dot: bottom right sit the important topics with poor ratings, i.e. the list for the next chief physicians' meeting.
- Referrer NPS: The Net Promoter Score with promoters, passives and detractors, filterable by specialty and referral frequency.
Go deeper
Related survey templates
- Relatives Survey (care home)The survey of residents' relatives: care, information, involvement and trust – analysable per unit and per home of a care provider.
- AUDIT-C – Alcohol consumption self-checkThe three consumption questions of the WHO AUDIT: frequency, quantity and binge drinking give a score from 0 to 12 with instant classification – free to use.
- Healthcare Staff SurveyAnonymous survey of nursing and practice staff on workload, appreciation and wellbeing in your practice or clinic.
- Patient Survey (PREM)Anonymous assessment of your patients' care experience based on Patient-Reported Experience Measures (PREM).
Frequently asked questions
How do we analyse by department without identifying the practice?
What is the point of the double matrix of satisfaction and importance?
Do physicians actually answer a survey like this?
Start with this template
Load the template into DataLion, adapt it to your brand and start collecting responses — GDPR-compliant, in minutes.