
🚀 Highlights
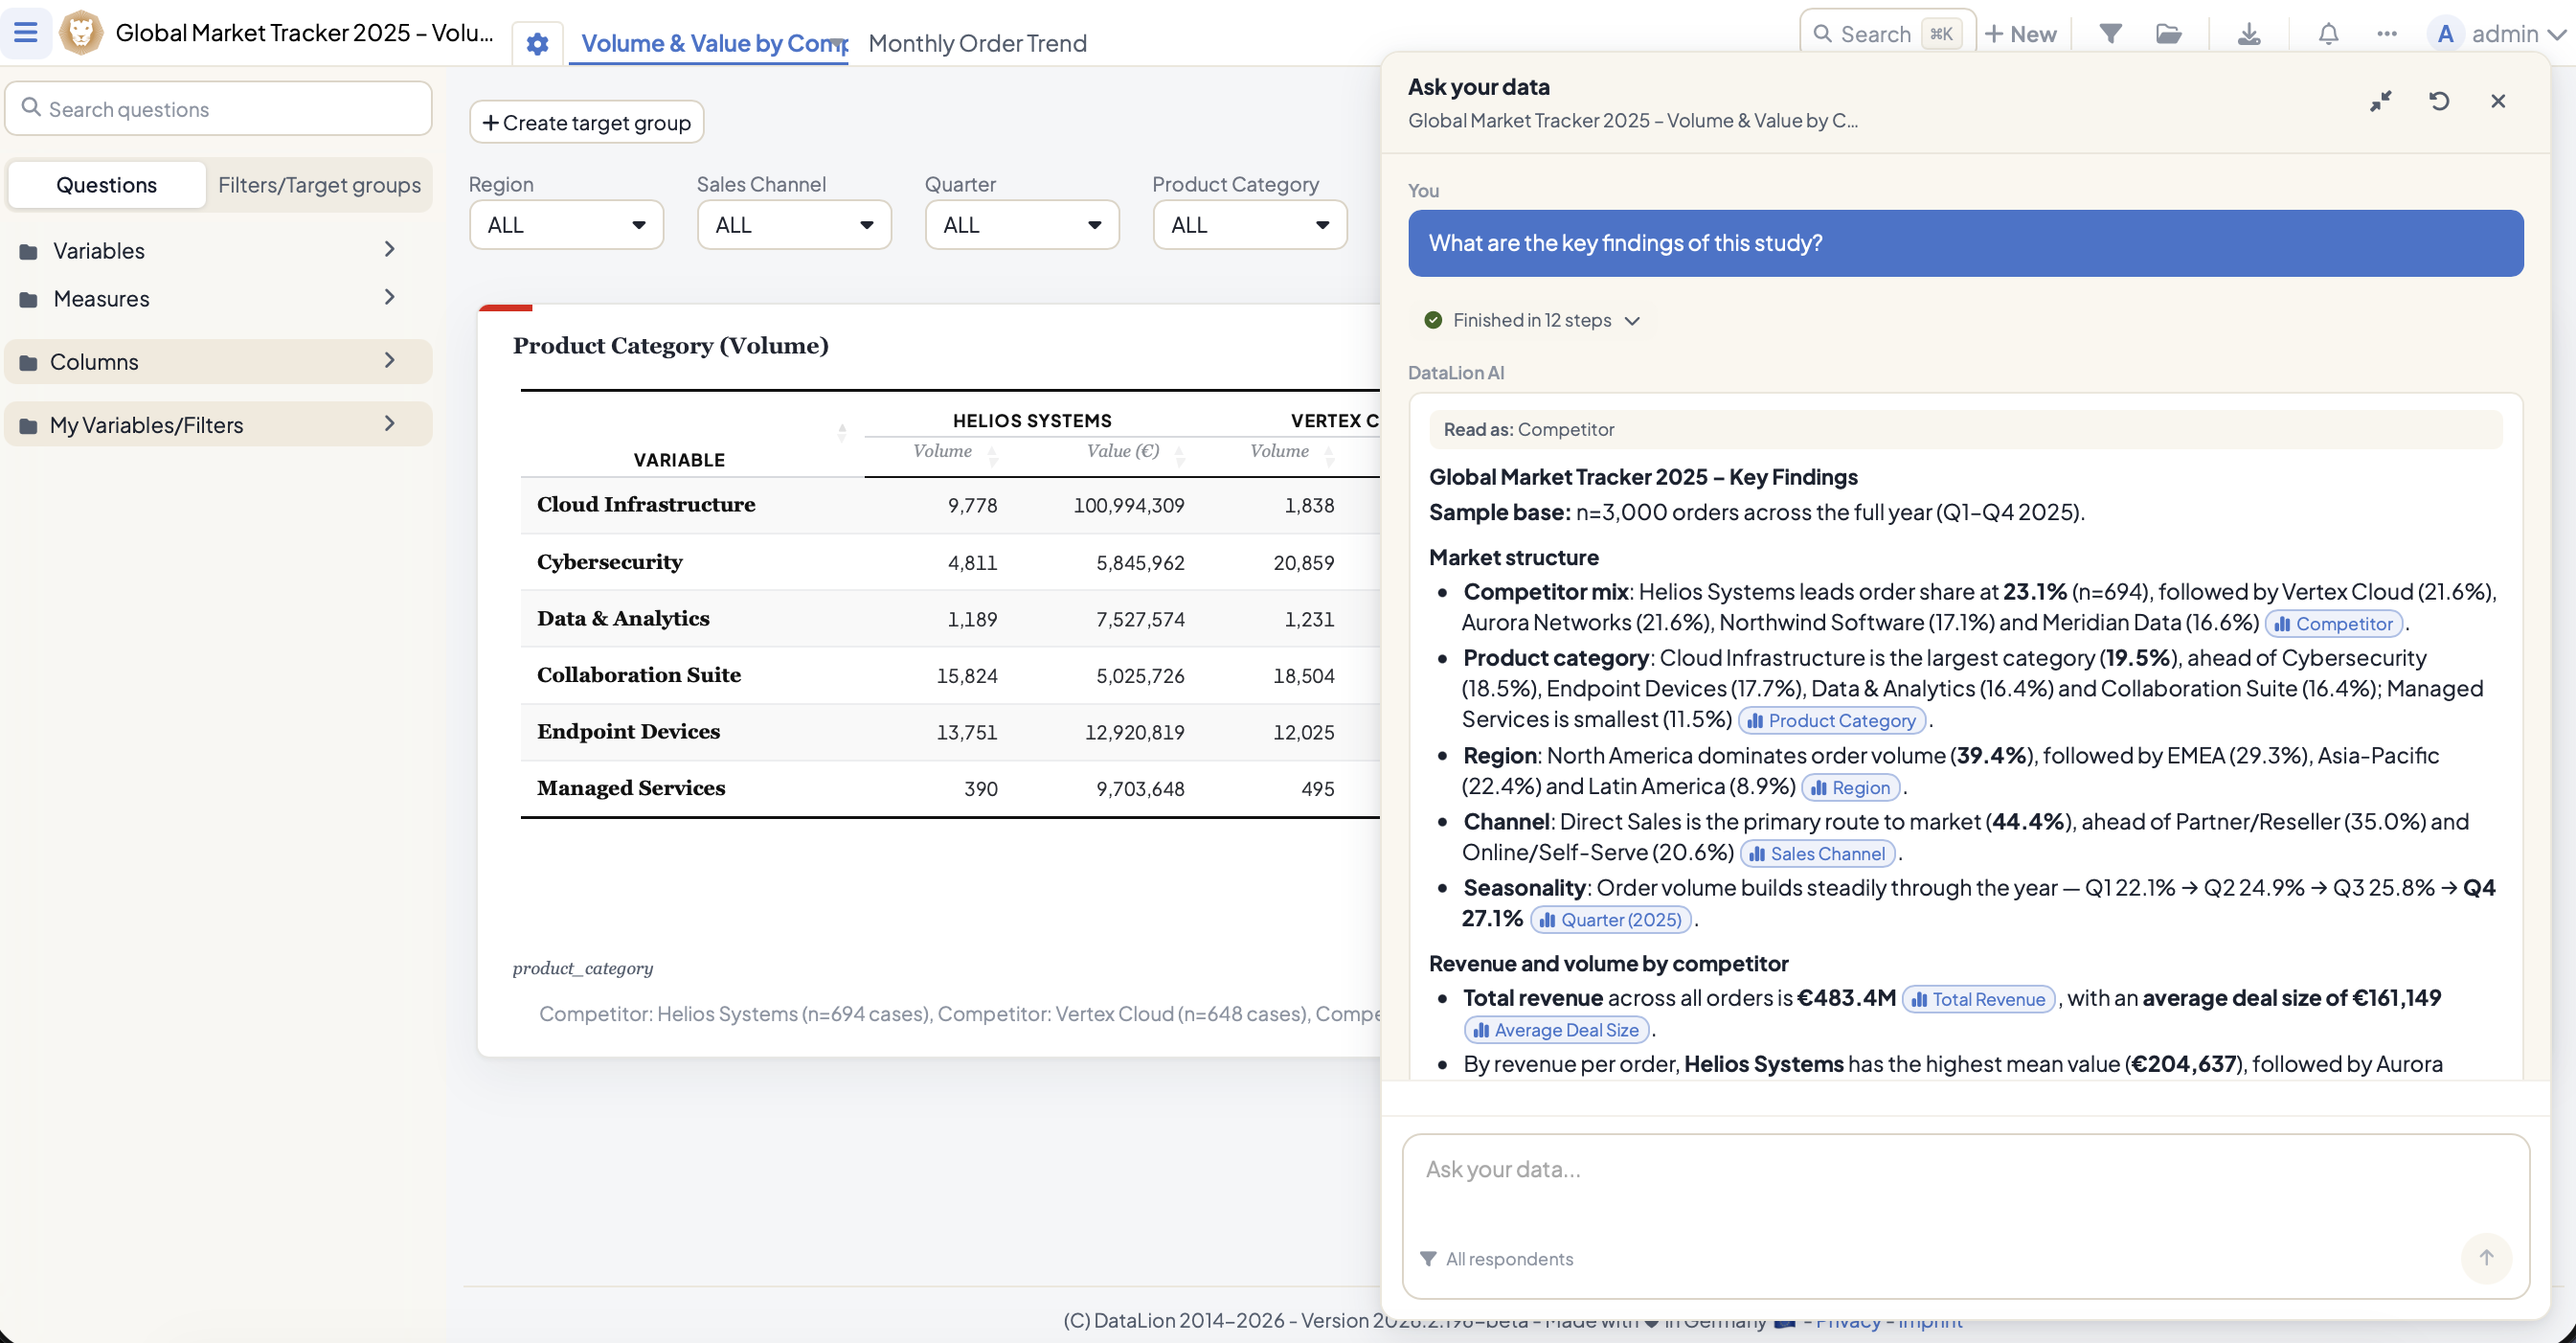
Ask your data – and get an answer that is grounded in the dashboard: The new AI panel turns a plain-language question into a clear answer, a chart, the applied filters, the base, significance notes, and a receipt of what was actually calculated. Every number comes from DataLion's weighted and filtered chart engine, so the explanation and the dashboard stay in sync.
Tracker studies now have first-class Waves: Recurring studies no longer need to treat field periods as an informal codebook convention. Under Admin → Projects → Waves you manage labels, field periods, case counts, upload provenance, and status. Append uploads can create a Wave, the timeline can use Waves as its time grain, the previous Wave automatically becomes the comparison period for benchmarks and significance tests, and every Wave can be exported on its own.
Every supported chart now uses the modern engine: Timeline, multiring, scatter, radar, polarity, multiline, multistack, and Gantt charts have moved to the current amCharts runtime. The retired engine and its export plugins are gone. That removes roughly 2 MB of JavaScript from every project page and gives all charts the same interaction and export path.
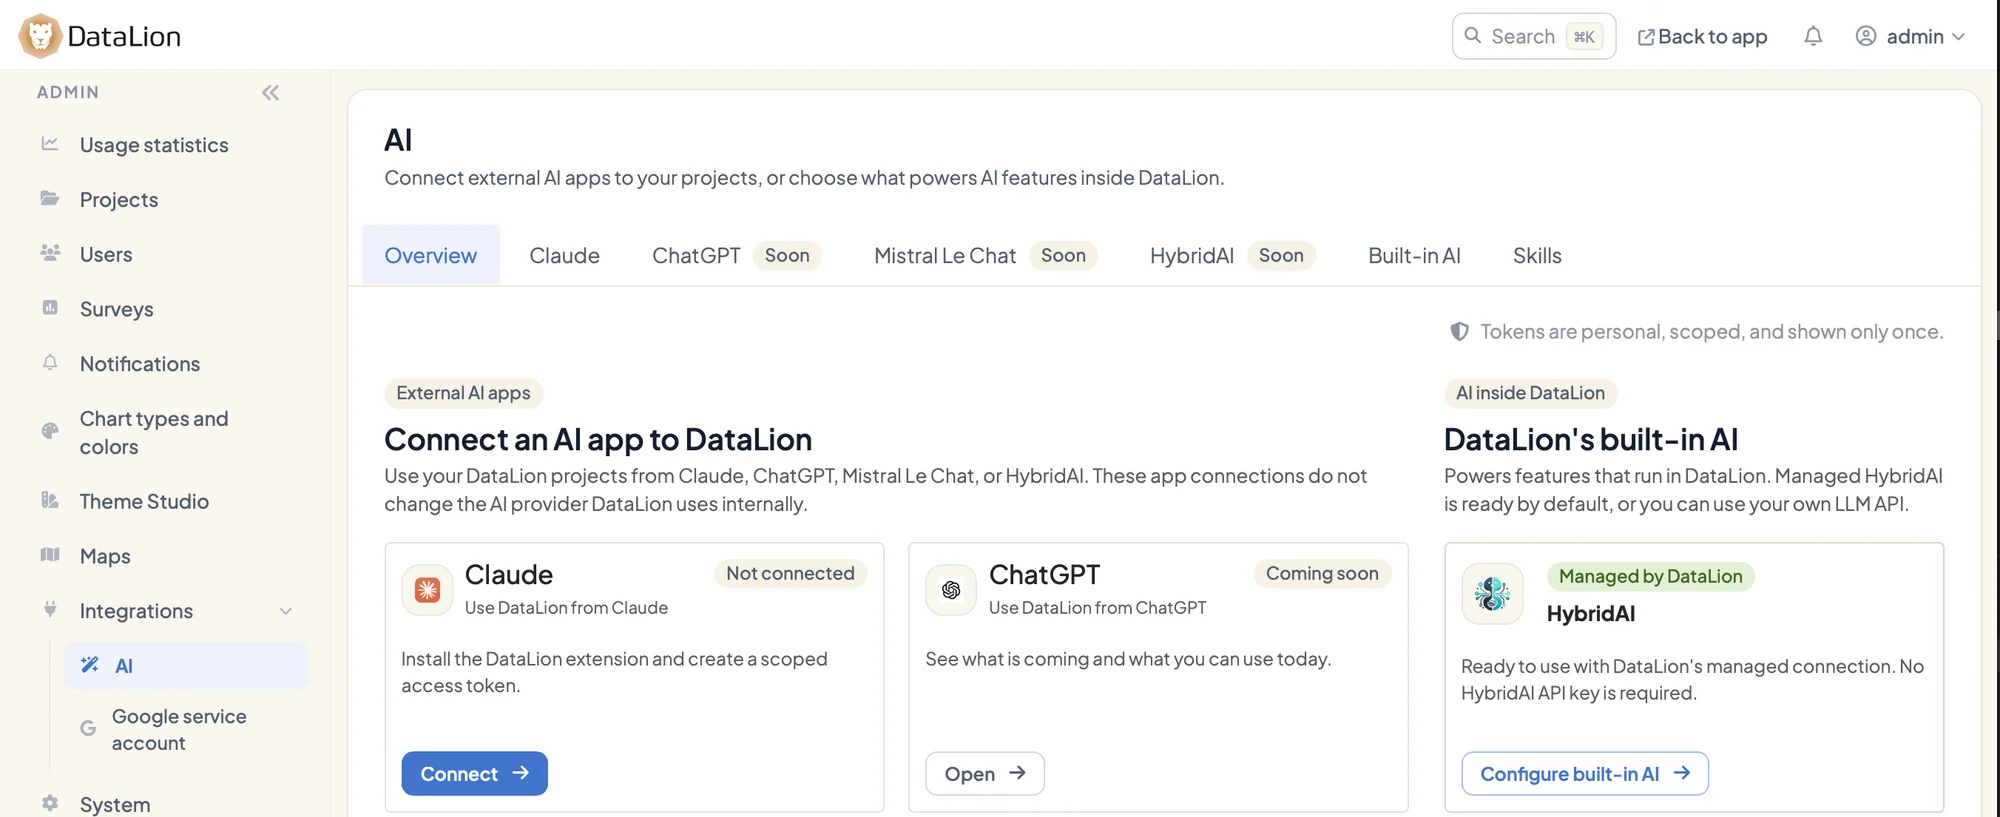
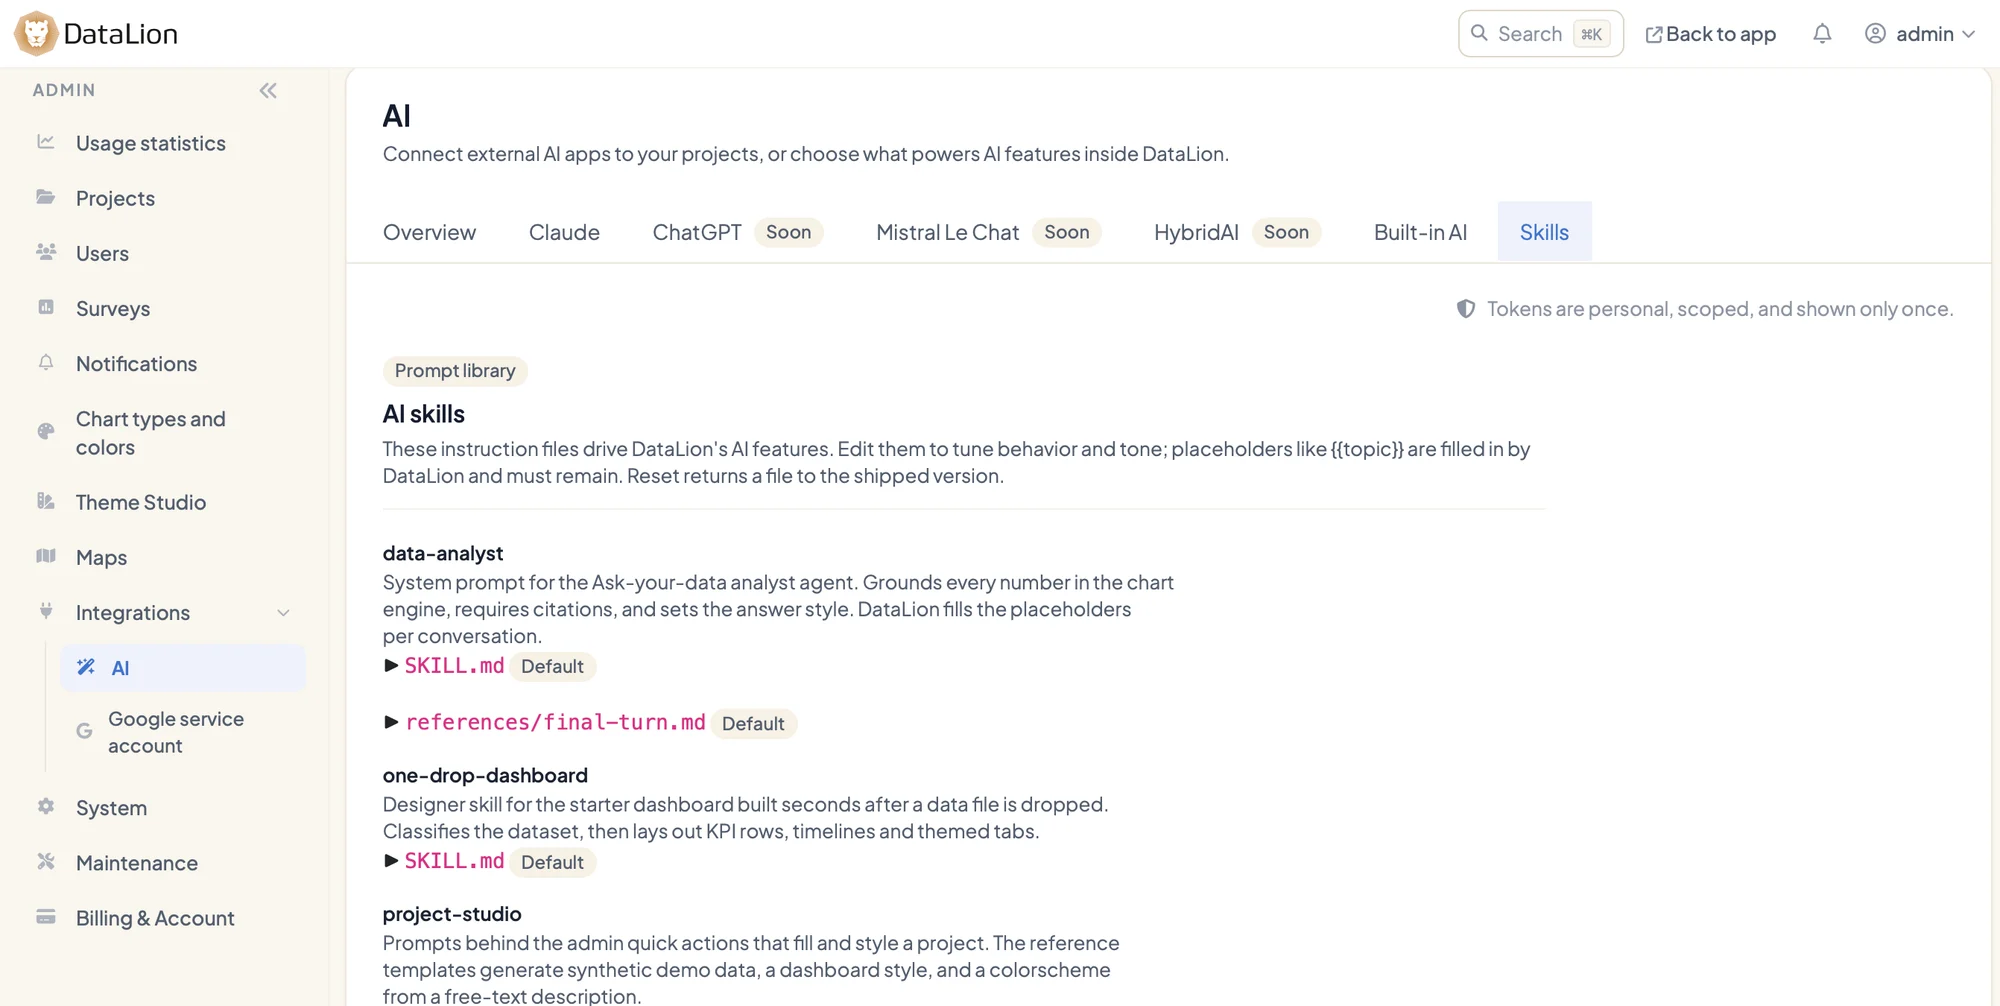
One AI hub – with skills you write yourself: Admin → AI brings Claude, ChatGPT, Mistral Le Chat, HybridAI, and the provider settings into one place. Under Admin → AI → Skills, the instructions that drive DataLion's AI features are out in the open – for analysis, survey design, text analytics, one-drop dashboards, and Project Studio. Administrators adapt them to their own terminology and house style, and reset to the shipped version at any time.
✨ What's New
📋 Portable, more powerful surveys: Under Admin → Surveys, a DataLion survey can be exported as a native JSON bundle and imported into another workspace – without carrying responses or publication state along. Survey authors also gain answer piping, reusable and randomized sections, broader branching and display rules, row-aware matrix logic, “Other” text columns, and server-evaluated scores.
∅ Missing values as a real category: Use the
<empty>value in the codebook and turn on Show missing values as category under Admin → Projects → Settings → Missing values, or in an individual chart. The gray No answer category stays last and travels into Excel and PowerPoint exports. A new codebook coverage check finds data values that still lack a label.📥 Triple-S and Dimensions import: One-drop and data-source uploads now also accept paired Triple-S
.sssplus.asc/.csvfiles and IBM Dimensions.mddplus.ddffiles – including labels and multiple-response definitions. They now sit alongside SPSS, Excel, and CSV.☁️ Google setup without server access: Store and verify an encrypted workspace service account under Admin → Integrations → Google. Then enable Google Slides and choose its Drive folder under Admin → Projects → Settings → Export defaults → Google Slides.
🔗 Secure embedding allowlists: Under Admin → Projects → Settings → Reports, project administrators list the exact websites allowed to embed shared dashboards. All other origins stay blocked.
🗑️ Self-service workspace deletion: Self-service workspace owners can permanently delete a workspace from the danger zone under Admin → Billing & Account. Active subscriptions must be cancelled first, and accounts shared with another workspace are preserved.
🏨 More ready-made studies: The library gains deterministic HR & People demos, a German employee survey, and bilingual templates for hotels, campsites, in-stay feedback, and restaurants. The employee survey demonstrates a practical anonymity threshold: groups that are too small stay blank, and readers see the project's explanation instead of a misleading zero.
📈 Improvements
📱 Dashboards work on phones: The question list becomes a slide-over, charts stack into one full-width column when a project has no custom mobile layout, and report controls, start-page cards, account navigation, and the footer stay usable on small screens.
🎨 One dashboard design language: Shared typography and design tokens now reach chart cards, report and project thumbnails, My Reports, the AI panel, navigation, notifications, settings, and maintenance pages. The DataLion Default palette is the reliable fallback for charts without their own configuration.
🔒 Clearer low-base protection: Warnings name the exact affected labels – across regular, multistack, timeline, waterfall, word-cloud, and table charts. DataLion honors the configured raw or weighted base and hides only the affected item in a mixed-base chart.
🌍 Translation-aware codebook imports: A regular codebook import recognizes exported
translation_*_<locale>columns and imports codebook data and translations together. Unmapped CSV columns no longer shift later values into the wrong fields.⚡ Faster chart loading: Cached chart responses avoid repeated preparation and case-count calculation, and equivalent project objects share stable cache keys.
🔐 Security
2026.2.195 draws the boundaries of the application tighter: shared dashboards can only be embedded on explicitly allowed websites, exports are once again consistently protected against calls from other sites, and the paths data takes into and out of DataLion are checked more strictly. Long-dormant old passwords can be given additional protection without locking anyone out.
🐛 Important Bug Fixes
- CSV and Excel uploads: Preview, auto-fix, and import now use the same column-name rule. Error messages name the problem column, reserved words are really fixed, duplicates that differ only by case are caught, and repeat uploads no longer rename existing columns.
- Colors and fonts: Chart palettes, font families, and font sizes match their saved project and chart settings again. Resetting a filter also restores the configured dropdown default.
- Usability: Chart settings controls stay reachable, modal overlays close cleanly, report tabs retain their width, report-user Select all / none works, and admin text areas can be resized again.
- Charts after the migration: Click-to-filter, timeline ranges and forecasts, multiring height, Reverse alignment, tooltip rounding, value-label contrast, and diverging polarity colors are correct again.
- More robust dashboards: Sparse grids and chart JSON ending in a backslash no longer crash during redraw or save. Protected table and heatmap values stay blank instead of becoming a false zero.
- Imports and integrations: Scheduled Google Drive imports, Dropbox credentials, and OAuth redirects stay in the correct workspace. Signup projects can open auto-import settings, and English codebook entry labels import correctly.
Enjoy DataLion 2026.2.195. As always, we would love to hear what you think – and especially which question you ask your data first.