Export
Charts as images, raw data as CSV
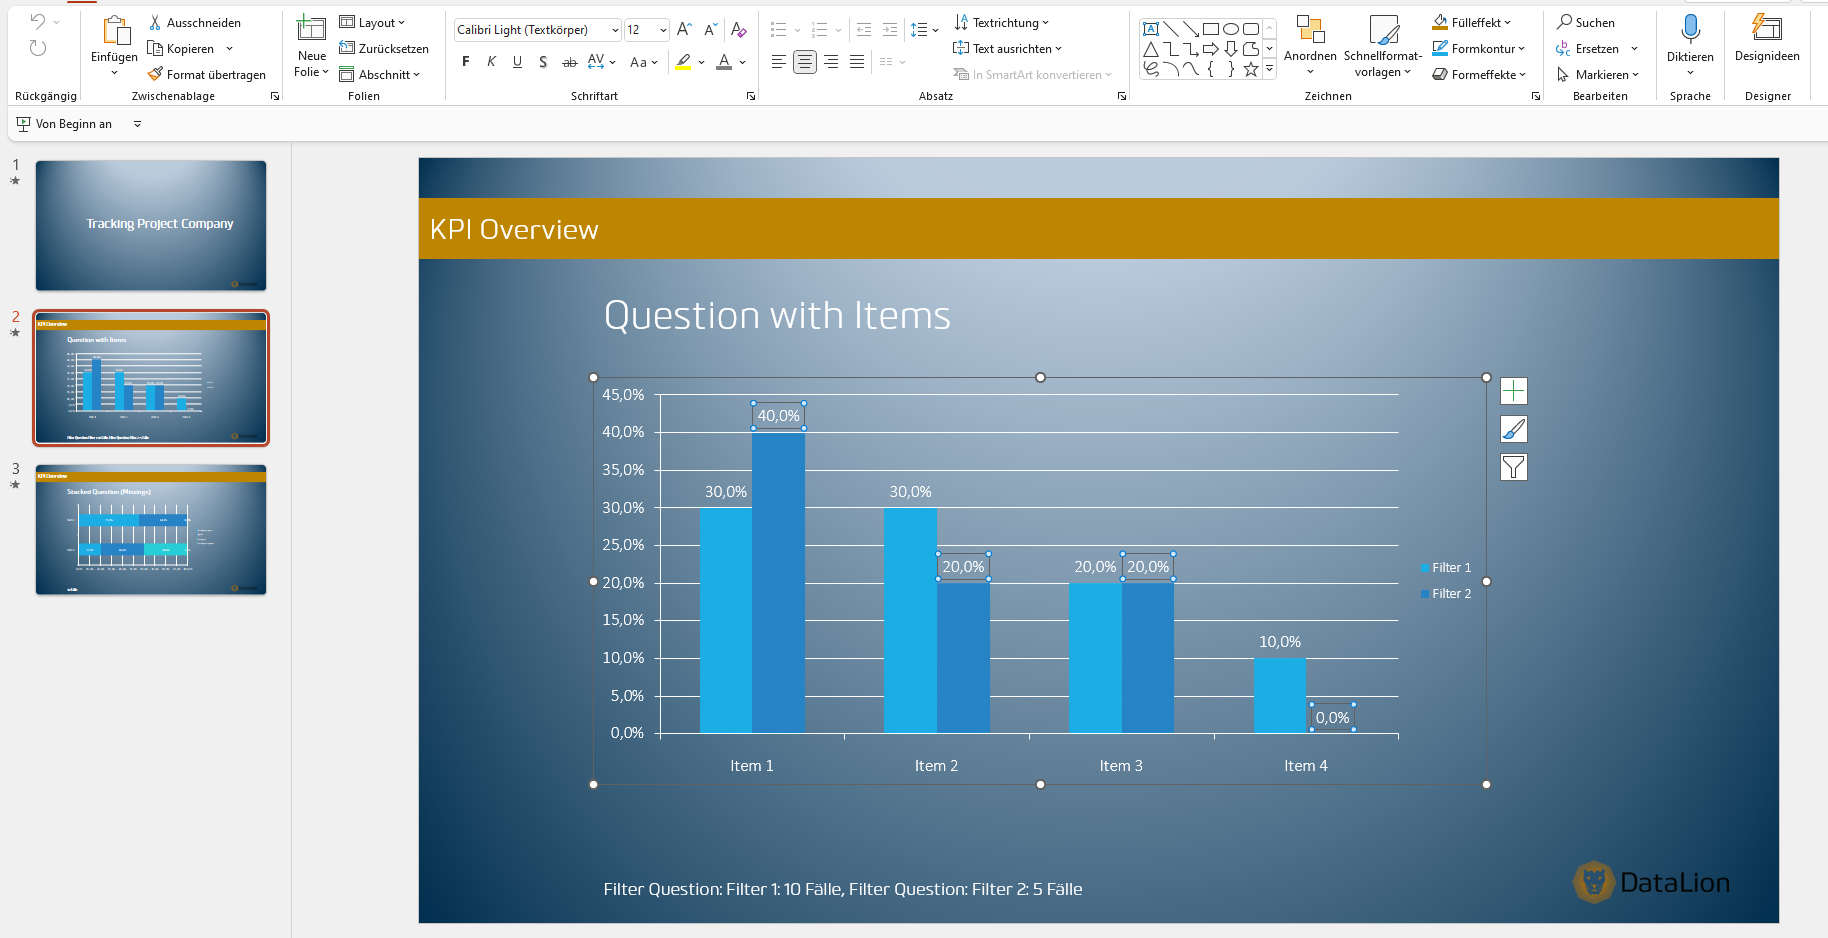
Export a single chart as PNG, JPEG or SVG — at a chosen resolution up to Ultra (3×). Download raw data and open-ended responses as case-level CSV.
DataLion exports single charts as PNG or JPEG at an admin-configurable resolution — Standard (1×), High (2×) or Ultra (3×) — as well as scalable SVG. You download raw data and open-ended responses as case-level CSV. Charts can additionally be output as an embedded website.
- 🇩🇪 Made in Munich
- GDPR-compliant
- DPA included
- Hosted in Germany
- 🌐 Interface in EN, DE, FR & NL
Trusted by research, insights & media teams
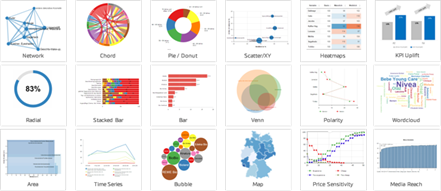
- 50+ interactive chart types
- 20+ statistical methods
- SPSS · Excel · CSV import without data loss
- ISO 27001 certified data centers (Germany)
PNG & JPEG — at a chosen resolution
Export each chart individually as PNG or JPEG. The resolution is admin-configurable: Standard (1×) for email, High (2×) for a deck and Ultra (3×) for print and large format.
You spot the higher tiers right in the filename — via the suffixes -high and -extrahigh. So in your asset folder it stays clear which variant you have in front of you.
- Single charts as PNG or JPEG
- Standard (1×), High (2×) and Ultra (3×)
- Filename suffixes -high and -extrahigh
SVG and embedded website
Where crisp scaling matters, export charts as SVG — lossless at any size, ideal for layout and print.
And when a chart belongs on the web rather than in a document, output it as an embedded website and place it wherever your stakeholders need it.
- Lossless SVG at any size
- Output as an embedded website
- Fits layout, print and web
CSV export of the raw data
When you need the numbers instead of the image, export them as case-level CSV — the raw data including open-ended responses, ready for your own analysis or hand-off.
That bridges from the dashboard back to the data. And when it should be the finished deck after all: the same content is available as natively editable PowerPoint, as an Excel report book and as PDF.
- Case-level CSV export
- Raw data including open-ended responses
- Plus PowerPoint, Excel report books and PDF
See DataLion with your own data
Start a free trial or book a personal demo — from raw data to a finished dashboard.
What users say about DataLion
- via G2
Very professional company, attentive to the customer needs, provider of a great software and service.
Generoso M. · CRM Analyst, Automotive - via G2
The contacts at DataLion are very committed. If you have problems, you can count on help. DataLion reacts quickly to requests for new functions.
Robert Q. · Managing Director - via G2
User-friendliness, especially for market research topics. Structured backend with many customization options.
Verified user · Market Research - via G2
The embedding function allows us to generate insights of our data for our audience and customers by far less than half of the usual time needed before.
Verified user · Leisure, Travel & Tourism

We now work much more efficiently, giving us more time to take care of the derivations and insights from the data for the customers.
More export features
Common questions about image and CSV export
At what resolution can I export charts as images?
Can I export charts as SVG?
Do I get the raw data behind a chart?
Are open-ended responses exported too?
What other export formats are there?
Export your first chart
Try DataLion free — or get a demo of how to export charts as high-resolution images and raw data as CSV.