The Codebook - Part 2
The codebook is a metadata file that defines the default settings of a project and links the dataset with DataLion.
This allows data to be visualized easily and quickly. The default settings can also be changed flexibly via the admin area of the dashboard.
Default settings:
-
Navigation structure (multiple variables can be bundled thematically, for example, which improves clarity)
-
Combining variables into a single chart
-
Labels (e.g. question text and categories)
-
Selection of the chart type
Structure of the codebook:
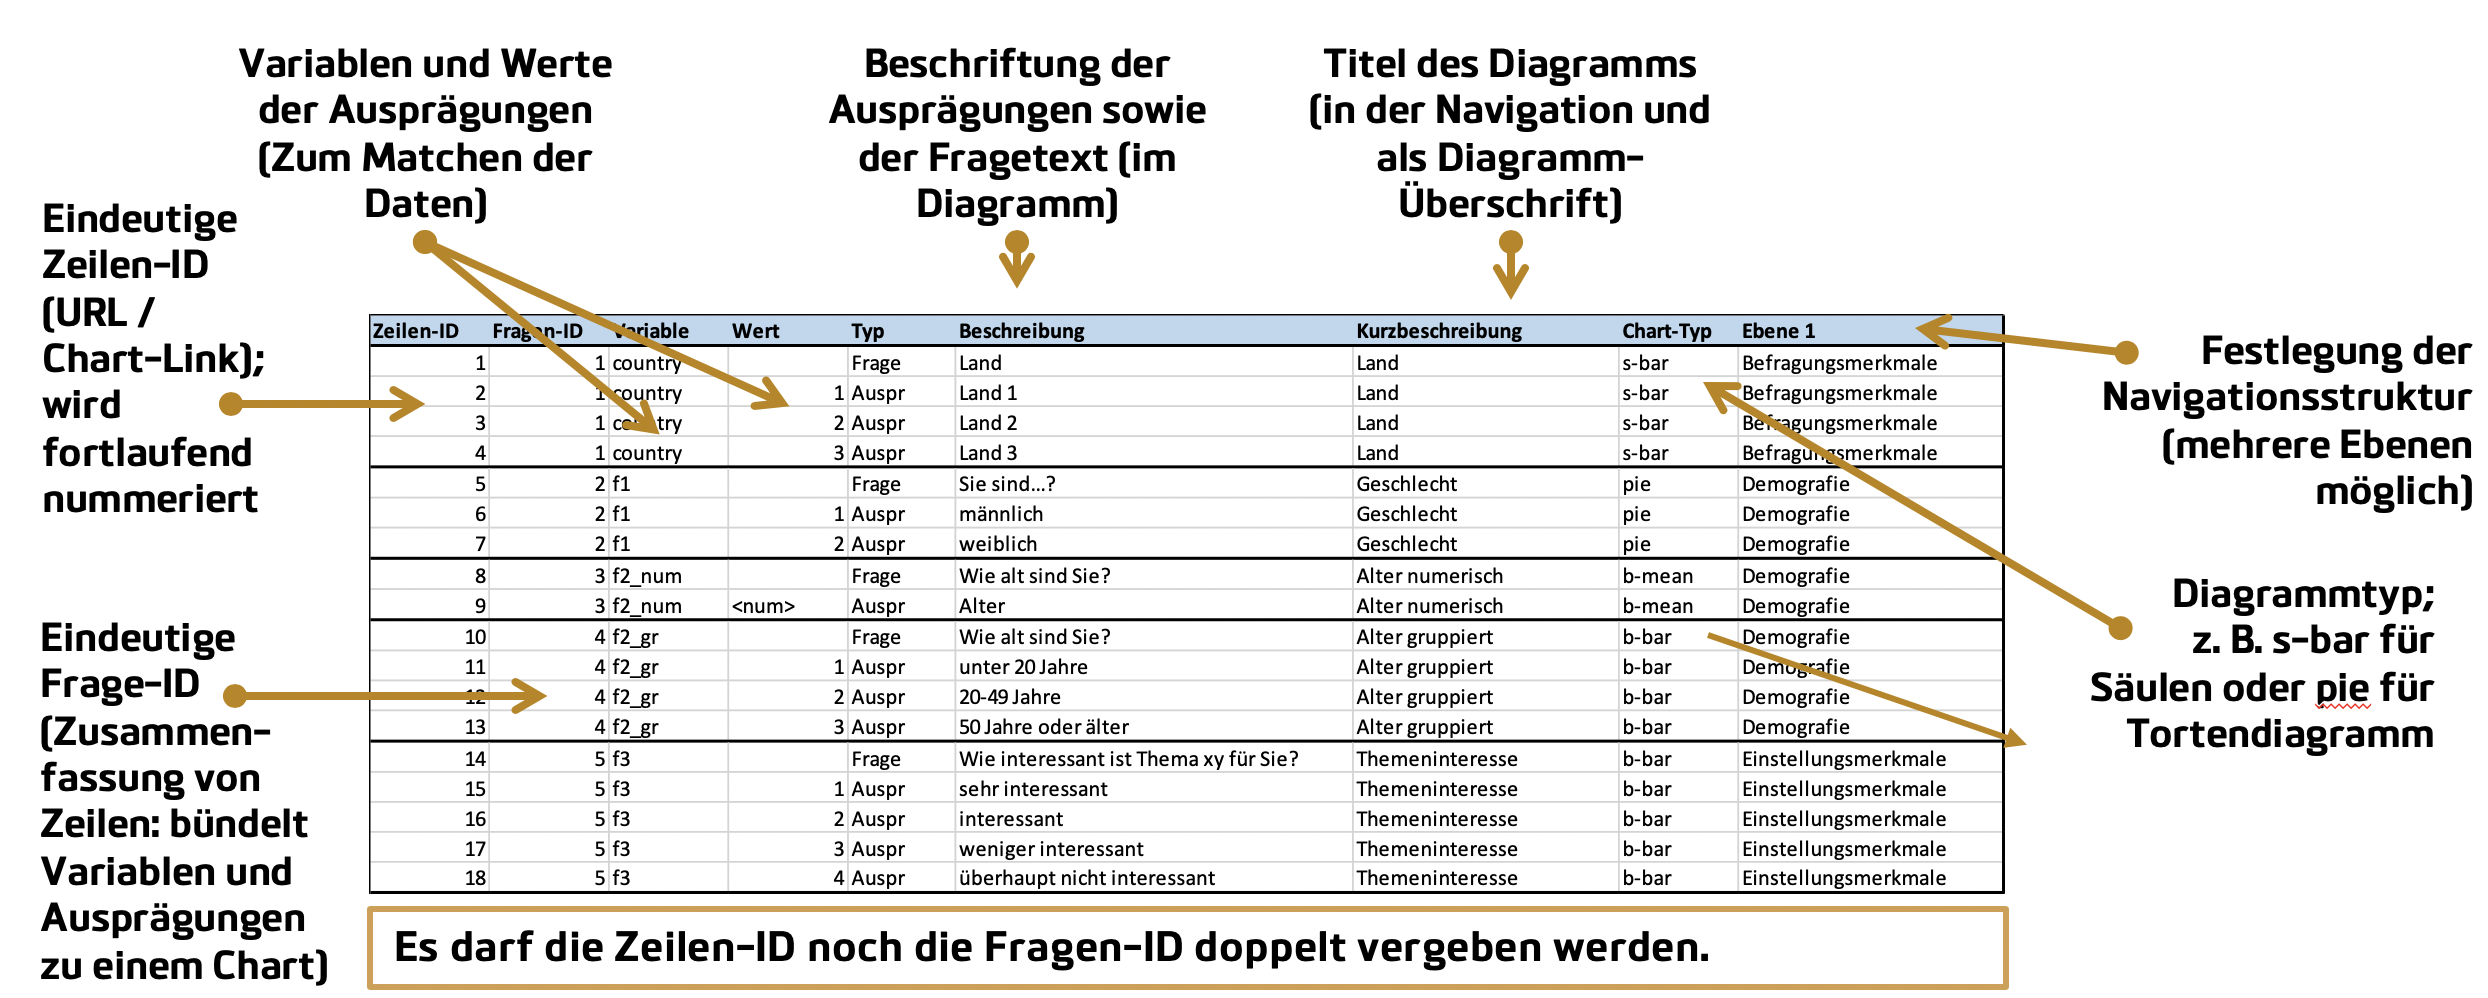
If you frequently create new codebooks, it makes sense to always work with the same arrangement of columns.
In Part 1 you will find an overview of all columns.
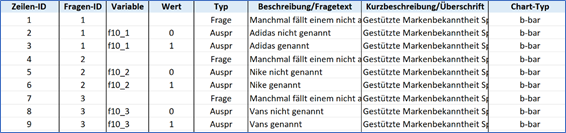
How can multiple responses be displayed in a single chart?
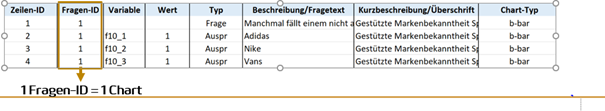
In the codebook, you can bundle multiple responses (variables with “0/1” coding) into a single chart. This works via the “Question ID” column. Variables that contain the same question ID are bundled into a single chart.
Example (before):
Example (bundled):
How can stacked column charts be displayed in a single chart?
In the codebook, you can also display several stacked column charts in a single chart. To do this, the chart type “multistack” is used and each characteristic is created one after another. Assignment to a chart works via the “Question ID” column. Characteristics that contain the same question ID are bundled into a single chart.
Example:

How can I recode or calculate variables?
In the codebook, you can also form new variables by using existing variables in the dataset for new categories or a calculation (command language: SQL).
You can find a collection of commands here: https://www.sibilla-egen-schule.de/schule/sch-service/anleit/Befehlssammlung_SQL.pdf
Recoding:
Recode means that you form a new variable by formulating conditions based on an existing variable. Recodes can be used as filters.
Calculation means that a new variable is calculated from an existing variable. Calculated variables cannot be used as filters.
Basis for recodes: In order for recodes to also be usable as filters, they must always be formulated with the following brackets {{( before the condition and )}} after the condition.
Examples of recodes:
Example 1: Forming Top2 boxes
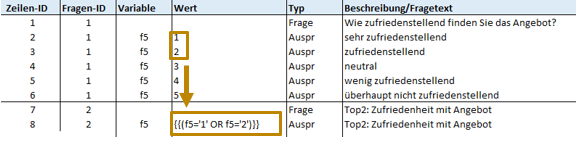
The condition for the Top2 box is that the values 1 and 2 of the variable f5, in this case the Top2 of the variable, are added together.
Formula: {{(f5=‘1’ OR f5=‘2’)}}
Example 2: Forming age groups
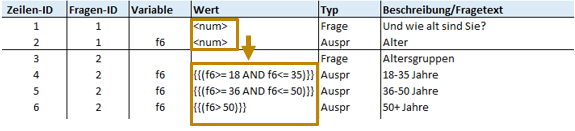
Here, age was recorded numerically in the variable f6. To now form age groups, conditions such as ‘all respondents who are 18 and older and younger than 36’ are formulated.
Formula: {{(f6>= 18 AND f6<= 35)}}
Example 3: Defining users / non-users
The variables f1, f2, and f3 have 6 categories.
If a respondent has selected category 1, 2, or 3 (AND) for at least one of the three variables (OR), they count as a user.
Formula for users (to be entered in the values field):
{{( (f1>=1 AND f1<=3) OR (f2>=1 AND f2<=3) OR (f3>=1 AND f3<=3) )}}
Consequently, respondents who have selected exclusively categories 4, 5, or 6 (AND) for all variables f1, f2, and f3 (AND), or who did not answer the questions at all (value: -99 (OR)), count as non-users.
Formula for non-users (to be entered in the values field):
{{( (f1>=4 AND f1<=6 OR f1=-99) AND (f2>=6 AND f2<=6 OR f2=-99) AND (f3>=4 AND f3<=6 OR f3=-99) )}}
Example 4: Count if
If a variable genre contains labels such as Drama, the frequency of the Drama genre can be counted via the following formula (to be entered in the values field):
{{(genre LIKE ‘%Drama%’)}}
Calculations
Basics for calculations:
-
Do not use spaces before/after calculation instructions such as SUM
-
Since calculated variables cannot be used as filters, the brackets {{ before and }} after the calculation instruction are sufficient
-
If you specify the chart type b-bar, there must be an equals sign after the curly brackets {{=
-
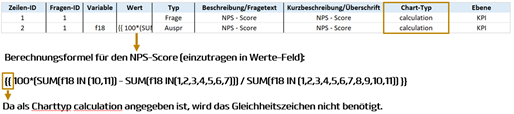
If you specify the chart type calculation, the equals sign is not needed {{
Example 1: Calculating the NPS score
Example 2: Calculating a total variable
With the following formula (to be entered in the values field), you can calculate a total variable, i.e. a variable in which all cases occurring in the dataset are counted:
{{= COUNT(*)}}
Example 3: Percentaging on a different basis
With the following formula (to be entered in the values field), you can percentage category 1 of a variable f1 on a different basis, here on the basis of all values that have category 1 in the variable total:
{{=(100*(SUM(f1 IN (1)))/(SUM(total IN (1))))}}
Example 4: Mean without including missing values
If a variable f1 contains missing values (defined as -77, for example), the -77 is taken into account when calculating the mean, which is why a nonsensical value is returned. With the following formula (to be entered in the values field), the mean of the variable f1 is calculated without the missing values:
{{=SUM(CASE WHEN f1= “-77” THEN f1 ELSE 0 END) / SUM(f1= “-77”)}}
Example 5: Calculating the absolute change in sales (12M, last 12 months)
With the following formula (to be entered in the values field), you can calculate the absolute change in sales:
SUM(CASE WHEN periode > (SELECT DATE_SUB(MAX(periode), INTERVAL 12 month) FROM dashboard_data_table_10) THEN absatz ELSE 0 end) - SUM(CASE WHEN periode > (SELECT DATE_SUB(MAX(periode), INTERVAL 24 month) FROM dashboard_data_table_10) AND periode < (SELECT DATE_SUB(MAX(periode), INTERVAL 12 month) FROM dashboard_data_table_10) THEN absatz ELSE 0 end)
Example 6: Calculating the change in sales in % (12M, last 12 months)
With the following formula (to be entered in the values field), you can calculate the change in sales as a percentage:
100 * (SUM(CASE WHEN periode > (SELECT DATE_SUB(MAX(periode), INTERVAL 12 month) FROM dashboard_data_table_10) THEN absatz ELSE 0 end) - SUM(CASE WHEN periode > (SELECT DATE_SUB(MAX(periode), INTERVAL 24 month) FROM dashboard_data_table_10) AND periode < (SELECT DATE_SUB(MAX(periode), INTERVAL 12 month) FROM dashboard_data_table_10) THEN absatz ELSE 0 end)) / SUM(CASE WHEN periode > (SELECT DATE_SUB(MAX(periode), INTERVAL 12 month) FROM dashboard_data_table_10) THEN absatz ELSE 0 end)
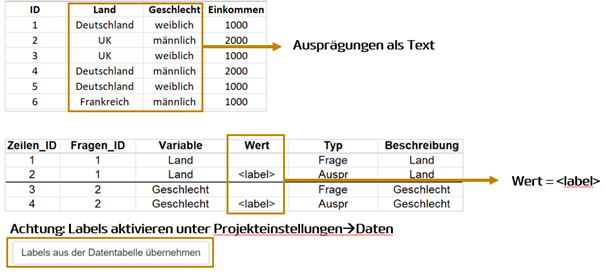
How can I read in non-numeric variables?
In the codebook, you can also create “labels” if the variables are not stored numerically.
Example: Dataset with “labels”
Special columns – sorting categories
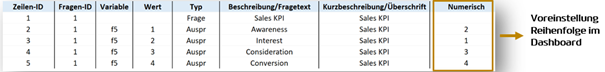
In the codebook, you can also define the order of the categories.
If you do not define the order, DataLion arranges the categories one after another by row ID. The sorting can be defined by a new column, named “display_order” or “numeric”, for example.
The “display_order” column
1,2,3,4,…: consecutive sorting according to the specified numbering
In the chart settings, you can change the sorting order (e.g. sort ascending or descending). If you want to fix a category in the sorting, for example to always place “Other” at the end, this is made possible by an additional column.
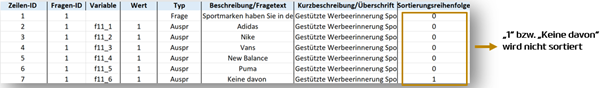
The “sort_prio” column:
1: does not sort a category, i.e. always places it last
0: all other categories that should remain sortable
Example 1: “Numeric” column
Example 2: “Sorting order” column
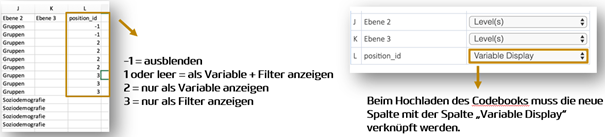
When uploading the codebook, the new columns must be linked to the “display_order” or “Sorting priority” column, respectively.
Special columns – configuring the navigation menu
In the codebook, you can also define the navigation menu, i.e. which variables should be shown and hidden (at the question/measure and filter level).
“position_id” column
Special columns – color scheme
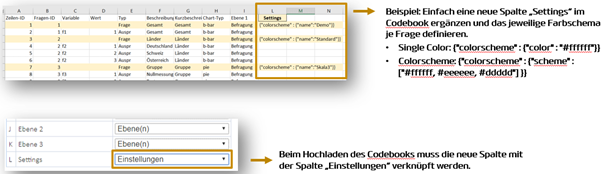
In the codebook, you can also configure an individual color scheme per question/measure.
“Settings” column