
A citizen survey is rarely run out of curiosity. At the end of it sits a council paper, a budget line or a priority list that somebody has to defend in public. So the questionnaire has to do two things at once: stay short enough that people finish it, and stay clean enough that the numbers survive the first hostile question in committee.
Below is a complete six-question template, plus the decisions around sampling and reporting that tend to go wrong.
Straight to the template: download the questionnaire as PDF (A4, 6 questions, no sign-up) or open it as an online template.
The template: six questions, about six minutes
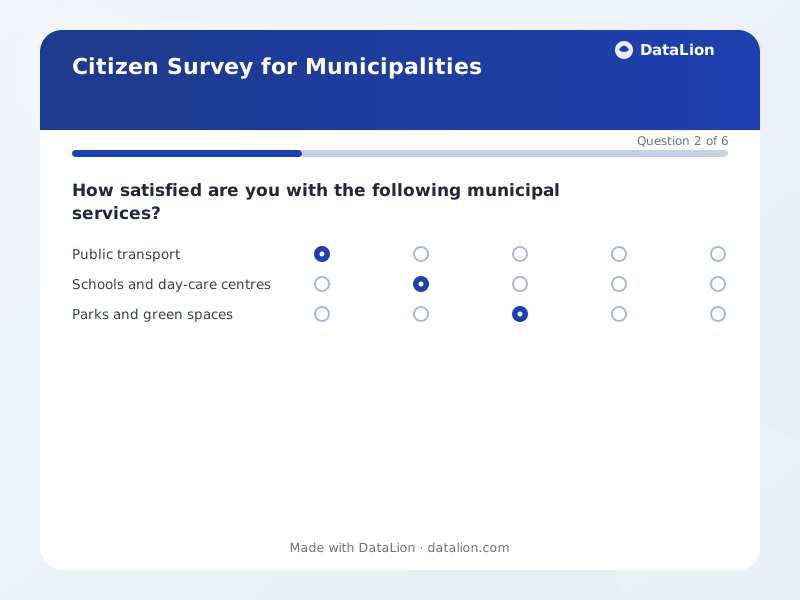
- “How satisfied are you with the following municipal services?” A matrix over six areas on a five-point scale from “very dissatisfied” to “very satisfied”: public transport, schools and childcare, parks and green spaces, safety in public spaces, administration and citizen services, cleanliness.
- “How would you rate the overall quality of life in our municipality?” Single choice from “very poor” to “very good”. The overall verdict deliberately comes after the individual ratings, otherwise the first vague impression colours everything that follows.
- “Which areas should take priority in future investment?” A ranking across public transport, education and childcare, green spaces and climate, safety, digital administration, and housing.
- “Which age group do you belong to?” Under 18, 18–29, 30–44, 45–59, 60–74, 75 and over.
- “Which district do you live in?” Adapt the list to your own administrative geography.
- “What should we improve first?” Free text, exactly one open question.
The two demographic questions sit near the end on purpose. They are the price respondents pay for the analysis, and asking someone their age in question one raises the drop-off rate. They are still indispensable for weighting later.
Random sample or open link: two different studies
The decision with the largest consequences happens before the first question. A random sample drawn from the population register and contacted by letter tells you something about residents. An open link on the city homepage tells you something about people who visit the city homepage and feel like answering a survey. Both are legitimate and both are useful, but only the first one may be called representative.
If you take the open route, say so in the report. It gets expensive when a self-selected participation survey is filed as a representative study and falls apart a year later under the first serious challenge.
As a rule of thumb, 400 to 600 usable responses carry a total-population read. What actually sets the number is the smallest cell you intend to report on. If the report says “safety by district and age group”, every one of those cells needs enough responses, and five districts times six age groups gets thin quickly.
Weighting, because the response never mirrors the population
Older residents answer more reliably than younger ones, and owners more reliably than renters. That is not a flaw in the survey, it is the normal case. Weighting to the known age and district distribution from official statistics corrects it. The part that matters is that the weighting also applies inside filters: a weighted headline next to unweighted district figures is a common and quiet source of error.
Anonymity is the basis of the exercise
Without credible anonymity you collect polite answers instead of honest ones. In DataLion the response record holds no IP address, no email address and no login, because those fields do not exist. Those fields are missing from the data structure, so there is no setting for somebody to switch off by accident.
The second half concerns reporting, and it gets overlooked. As soon as you filter by district and age group at the same time, you create cells with very few people in them, and in a district with four respondents aged 75 and over, anonymity is arithmetically gone. A minimum case count per project or chart handles this: when the base falls below the threshold, the value is suppressed rather than shown. The Excel export honours that threshold. The PowerPoint export does not, which is worth knowing before slides leave the building.
More on how the data is stored is on the security and privacy page.
What you analyse
The satisfaction matrix produces a top box per service, meaning the share of satisfied and very satisfied residents. Those boxes are computed automatically for every scale question, and the real work is reading them properly: a public transport score of 41 percent says very little until the previous wave or another district sits next to it.
The ranking question answers what the committee actually asks, which is where to start. It gets interesting when it contradicts the satisfaction data. If green spaces score well and still land near the top of the investment list, you have found a topic that satisfaction scores alone would have hidden.
The open question is the part most administrations underestimate, because coding it is manual work. It gives you the words residents use to describe their own concerns, and for communicating results those are often worth more than the percentages. Condensing open responses into themes is covered under data preparation, and the significance tests for comparing waves or districts under analysis and statistics.
Four mistakes that keep repeating
The questionnaire grows. Six questions become twenty-five while departments review it, because every department would like one of its own. Response rates fall, drop-off rises, and the cells end up too small for exactly the analysis those extra questions were added for.
The scale changes between questions. Five points in one matrix, four in the next, a school-grade scale somewhere in the middle. That is tiring to answer and it makes the values incomparable with each other.
The district list does not match the administrative geography. If the survey offers five compass directions while the statistics office works with twelve districts, the results cannot be joined to the data you already have.
And the second wave arrives without a plan. A citizen survey earns its value in comparison over time. Rewording the questions after three years because they sound dated trades a time series for a new baseline year.
The template
The citizen survey template contains the six questions above in finished form, anonymous by construction and adaptable to your districts in minutes. You can click through the questionnaire without an account before you adopt it. For a paper version, for instance to lay out at the town hall, the same questions are available as a printable PDF. More public-sector templates are in the template library.