
In short: The Net Promoter Score is the best-known loyalty metric, but a single number does not explain why customers stay or leave. Anyone measuring customer experience today combines NPS with more targeted metrics (CSAT, CES), a behaviour-based growth metric (Earned Growth Rate) and, above all, the AI-assisted analysis of open-ended answers. This article walks through the most important NPS alternatives, when each one makes sense, and what state of the art means today.
Why think beyond NPS?
NPS has good reasons for being so widespread: one question, one number, comparable everywhere. But that same frugality is also its weakness:
- No "why". An NPS of +30 does not tell you what to improve: the actual insight sits in the open-ended answers, not in the scale.
- The recommendation question does not fit everywhere. "Would you recommend us?" makes little sense for a monopoly, a public authority or a one-off purchase.
- Scale and culture bias. Some markets rate systematically more generously or more harshly than others, which distorts international comparisons.
- Easy to game. Once bonuses depend on NPS, people ask again, filter and "coach": the number rises, reality does not.
- Relationship ≠ transaction. A single annual relationship NPS misses what actually happens at specific touchpoints (support, onboarding, checkout).
The answer is rarely "abolish NPS", it is "complement NPS". Here are the most important building blocks.
CSAT – satisfaction at a single touchpoint
The Customer Satisfaction Score (CSAT) measures satisfaction with one specific interaction: "How satisfied were you with …?" on a scale of 1–5 (or 1–7). It is usually reported as the share of top boxes (satisfied + very satisfied). CSAT is transactional: ideal immediately after a support contact, a purchase or onboarding, while the experience is still fresh. Start right away with the ready-made CSAT survey template.
CES – how easy do you make it for your customers?
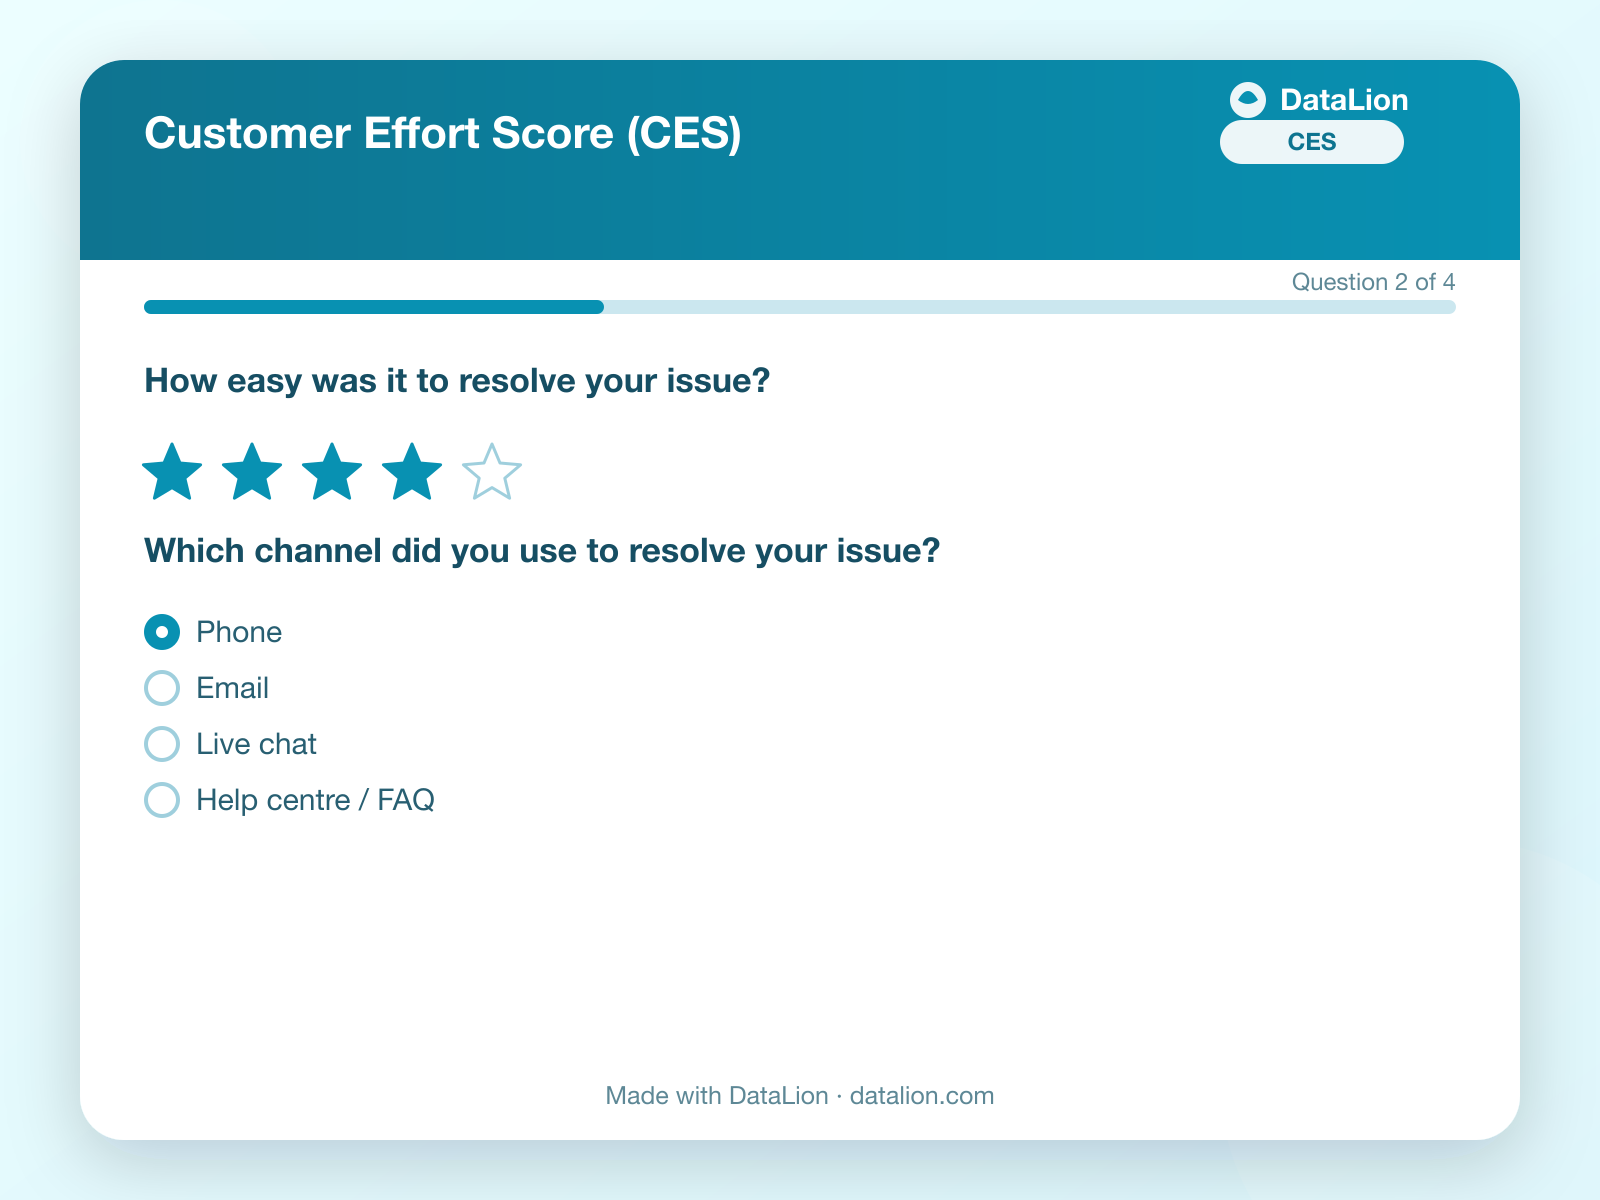
The Customer Effort Score (CES) flips the perspective: not "how delighted are you?" but "how much effort did you have to put in to get your issue resolved?". The research behind CES (notably The Effortless Experience) shows that low effort often predicts loyalty and repeat purchase better than delight does. CES is the strongest leading indicator of churn at service and process touchpoints. Start right away with the ready-made CES survey template.
NPS, CSAT and CES compared
| Metric | The question measures… | Scale | Best for |
|---|---|---|---|
| NPS | Willingness to recommend / loyalty | 0–10 | Overall relationship, benchmarking |
| CSAT | Satisfaction with one interaction | 1–5 | A single touchpoint |
| CES | Effort required to resolve an issue | 1–7 | Service, early churn warning |
Earned Growth Rate – the NPS inventor's own answer
The most interesting "what comes after NPS" answer comes from Fred Reichheld himself, the inventor of NPS. In Net Promoter 3.0 (Harvard Business Review, 2021) he introduces the Earned Growth Rate (EGR), a metric that is not based on survey answers but on actual customer behaviour, and that can be evidenced from the books. It has two components:
- Net revenue retention – how much revenue you retain and expand within your existing customer base.
- Earned new customers – the share of new customers who arrive through referral rather than paid marketing.
The upside: EGR is hard to game and directly tied to real, profitable growth. The price: you need clean tracking of revenue, retention and acquisition source: more work than a survey, but more dependable.
The real leap: from the number to the why
The biggest innovation is not a new metric but a new form of analysis: understanding open-ended answers (verbatims) automatically. Instead of reading hundreds of free-text comments by hand, AI now takes over sentiment and topic analysis, which automatically detects the sentiment (positive / neutral / negative) and the recurring topics (price, support, delivery time …) behind each score.
That turns "our NPS has dropped" into a concrete "our NPS has dropped because delivery times in region X are perceived as too long". This step, from the score to the cause, is exactly what separates modern CX measurement from pure numbers reporting.
State of the art: continuous, combined, diagnostic
Leading CX programmes no longer rely on an annual number but on a system:
- Combined rather than single: relationship NPS for the big picture, CSAT/CES at the touchpoints, EGR for management.
- Continuous rather than once a year: ongoing measurement in tracker dashboards instead of a snapshot.
- Diagnostic rather than descriptive: driver analyses show which factors really move the score; significance tests separate real change from noise.
- Text and numbers together: closed metrics and AI-analysed verbatims in one shared dashboard.
Which metric should you choose?
- Overall customer relationship / benchmarking: NPS – established and comparable (NPS template).
- A specific touchpoint (support, purchase, onboarding): CSAT.
- Processes and service, churn risk: CES.
- Growth from customer loyalty (management view): Earned Growth Rate.
- The "why" behind every number: AI verbatim analysis – as a complement to all of the above.
So the best answer to "what comes after NPS?" is not a single replacement metric but a small set that matches your touchpoints, plus automated analysis of the open-ended answers.
From metric to decision: in DataLion you measure NPS, CSAT and CES, analyse open-ended answers with AI sentiment and topic analysis and track everything live in tracker dashboards, on your own data, click-based. Read the NPS guide or try DataLion for free.