
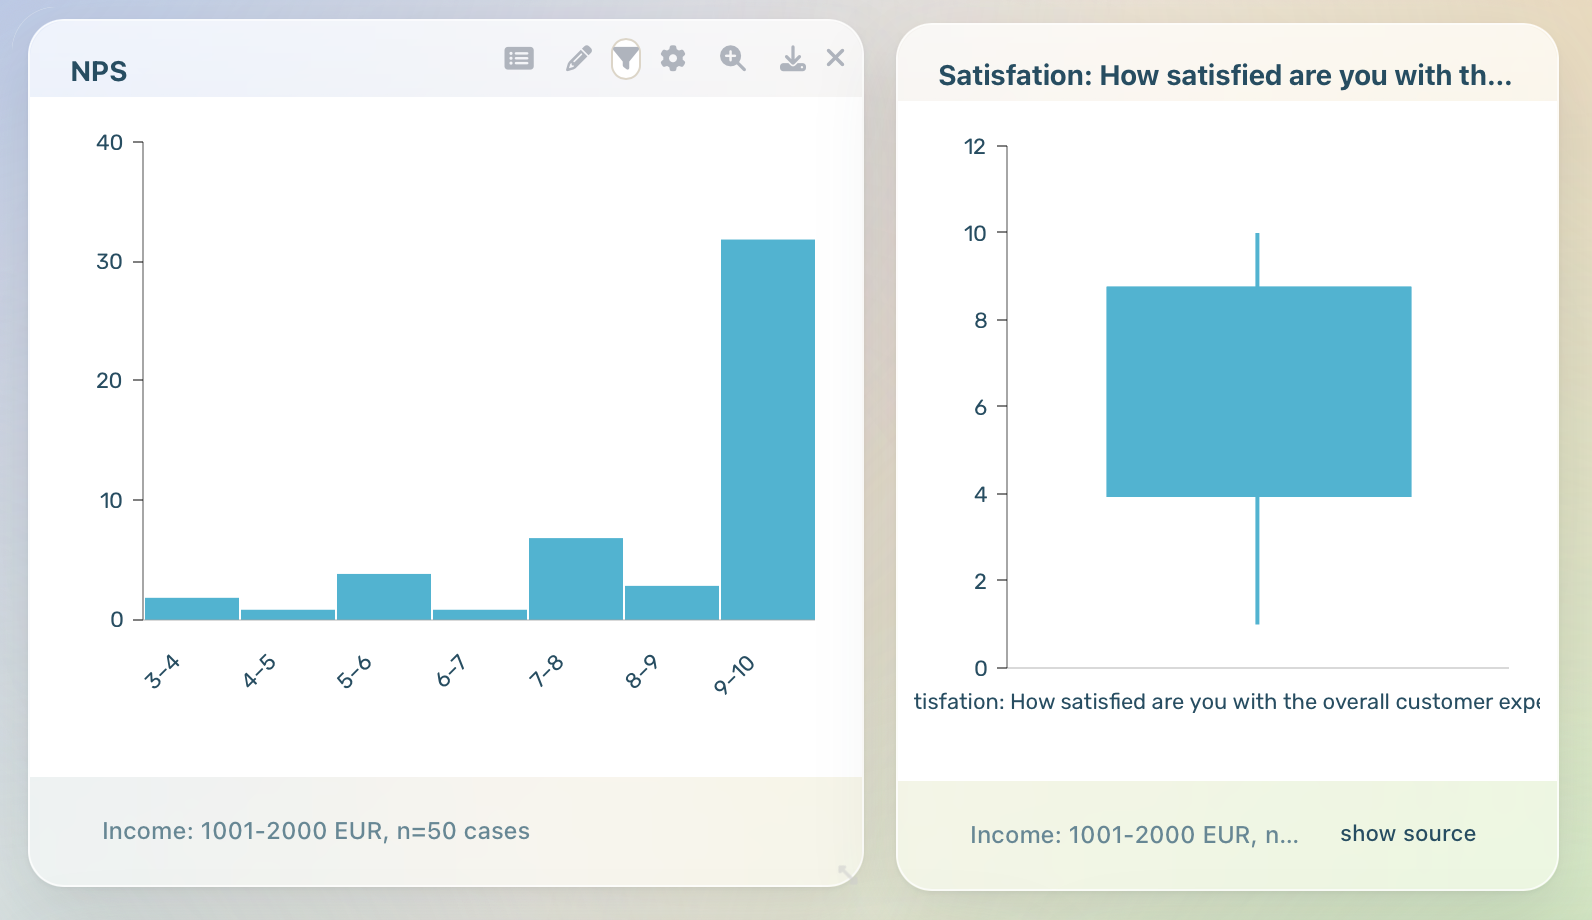
In short: An NPS survey measures customer loyalty with a single question – the recommendation question – on a scale from 0 to 10. The Net Promoter Score is calculated as the percentage of promoters minus the percentage of detractors and ranges from −100 to +100. This guide shows you how to create an NPS survey, calculate the NPS (calculator included) and analyze the results correctly – with the formula, the scale, benchmarks and the most common mistakes.
What is an NPS survey?
An NPS survey (Net Promoter Score survey) is probably the best-known method for measuring customer loyalty and willingness to recommend. The concept goes back to Fred Reichheld (Bain & Company), who introduced it in the Harvard Business Review in 2003 under the title "The One Number You Need to Grow". The idea: instead of long questionnaires, a single question is enough to reveal how strongly people stand behind a company, product or brand.
The standard question is:
"How likely are you to recommend [company / product / brand] to a friend or colleague?"
It is answered on a scale from 0 to 10 – from 0 ("not at all likely") to 10 ("extremely likely"). The answers produce a single figure that is easy to communicate and to compare over time. This very simplicity makes NPS one of the most widely used KPIs in customer experience management.
The NPS scale: promoters, passives and detractors
For the analysis, responses on the NPS scale are split into three groups. This split is the core of every NPS calculation:
| Rating | Group | Meaning |
|---|---|---|
| 9–10 | Promoters | Enthusiastic and loyal. They stay, buy more and actively recommend you. |
| 7–8 | Passives | Satisfied but not enthusiastic. Easily poached and not counted as advocates. |
| 0–6 | Detractors | Unhappy. They voice criticism, damage your reputation and are more likely to churn. |
Important: the passives count toward the total number of responses (the base) but do not appear in the formula itself. They "dilute" the score because they lower the share of promoters and detractors – one reason many companies deliberately try to turn passives into promoters. Technically, this grouping can be modeled as net/top-box coding.
The NPS formula
The NPS formula is deliberately simple:
NPS = % promoters − % detractors
Both shares are calculated on the basis of all responses (promoters + passives + detractors = 100%). The result is a whole number between −100 (everyone is a detractor) and +100 (everyone is a promoter). NPS is reported as a number, not a percentage – even though it is derived from percentages.
Worked example
Suppose you collected 500 responses:
- 300 promoters → 300 / 500 = 60%
- 125 passives → 125 / 500 = 25% (not included in the formula)
- 75 detractors → 75 / 500 = 15%
Plugged into the formula: NPS = 60% − 15% = +45. Your Net Promoter Score is therefore 45.
Calculate your NPS: the interactive calculator
Don't want to work it out by hand? Simply enter the number of promoters, passives and detractors into the NPS calculator – the Net Promoter Score, the percentage split and the calculation are shown instantly.
NPS calculator
Enter the number of responses per group – the Net Promoter Score is calculated instantly.
The calculator is ideal for a quick overview. As soon as you measure regularly, break results down by segment or want to weight for representativeness, it pays to calculate directly on your raw data – more on that below under "Calculate and track NPS on your own data".
Creating an NPS survey: step by step
A robust NPS survey is more than just the one question. These six steps take you from defining the objective to results you can act on:
1. Define the goal: relational or transactional NPS
With a relational NPS you ask at fixed intervals (e.g. quarterly) about the overall relationship with the brand – ideal for loyalty tracking. With a transactional NPS you ask right after a specific interaction (purchase, support case, onboarding) to evaluate individual touchpoints. Decide upfront which of the two perspectives you need – it drives the timing and the wording.
2. Word the recommendation question cleanly
Use the 0–10 scale with clearly labeled endpoints ("not at all likely" to "extremely likely"). Keep the question neutral and tie it unambiguously to what you want to measure (company, product or a specific touchpoint).
3. Add the open-ended "why" question
The real gold is in the follow-up: "What is the most important reason for your rating?" Only the open-ended answers explain why someone is a promoter or a detractor. With AI-powered sentiment and topic analysis, hundreds of verbatims can be condensed automatically into drivers and themes.
4. Set the scale and design
Stick with the classic 0–10 scale – it is the standard and keeps your scores comparable. Make sure the design is mobile-friendly and on-brand so the response rate stays high.
5. Choose the audience and timing
Send transactional surveys shortly after the interaction, relational ones in fixed waves. Reach your audience via link, QR code or email invitation – see survey distribution.
6. Collect enough responses
NPS is sensitive to small samples. As a rough rule of thumb, aim for at least 100 responses per segment you want to analyze separately – more for stable trends.
Fast start: instead of starting from scratch, use a ready-made NPS survey template – including the recommendation question and the open follow-up. For employee surveys there is a matching eNPS template, and the template library holds more questionnaires on customer satisfaction and loyalty.
Analyzing NPS: from the number to action
A single NPS figure says little on its own. NPS analysis only becomes valuable once you break the score down and connect it to the reasons behind it:
- Segment: calculate NPS separately by product, region, touchpoint or customer segment. That reveals where loyalty is built – and where it breaks. Whether differences are real or random is settled by significance tests.
- Code the open answers: condense the "why" question into themes and tie them to promoters and detractors – the fastest route from "what is our NPS?" to "what should we change?".
- Identify drivers: a driver analysis shows which experiences pull NPS up or down the most.
- Track over time: NPS delivers its value as a trend. With tracker dashboards you watch every wave and see changes instantly.
- Weight for representativeness: if your sample deviates from the population, data weighting keeps the figures reliable.
- Close the loop: reach out to detractors actively (closed-loop feedback). It prevents churn and turns criticism into an improvement lever.
NPS benchmark: what is a good NPS score?
The most common question is: what is a good NPS score? As a rough orientation:
| NPS score | Interpretation |
|---|---|
| above +70 | Excellent – world-class loyalty |
| +50 to +70 | Very good |
| +30 to +50 | Good |
| 0 to +30 | Needs work – more promoters than detractors, but room to grow |
| below 0 | Critical – there are more detractors than promoters |
These zones are general guidelines. A "good" NPS depends heavily on your industry, market and survey method. For rough orientation, some typical ranges (indicative values that vary by source and year):
| Industry | Typical NPS range |
|---|---|
| Software / SaaS & technology | approx. +30 to +45 |
| E-commerce & retail | approx. +30 to +50 |
| Insurance | approx. +20 to +40 |
| Banking & financial services | approx. 0 to +30 |
| Telecommunications | approx. −10 to +25 |
Two things matter with NPS benchmarks: first, response cultures differ by region – people in some markets rate more conservatively than others, so the same raw number is not equally strong everywhere. Second, the most meaningful benchmark is your own development over time plus a direct comparison with competitors who measure with the same method. Don't chase someone else's number – improve your own trend.
Looking ahead: NPS is the best-known CX metric, but not the only one. Which alternatives exist (CSAT, CES, Earned Growth Rate), how to analyse open-ended answers with AI and what counts as state of the art today is covered in What comes after NPS?
Common mistakes in NPS surveys
- Collecting only the number: without the open follow-up, NPS stays a metric with no actionable insight.
- Samples too small: with few responses the score swings wildly – be careful interpreting small segments.
- Changing the scale: deviating from 0–10 (e.g. 1–5) makes your scores incomparable with benchmarks.
- Leading questions: suggestive wording or incentives for good ratings bias the result.
- Wrong timing: asking too early, too late or too often (survey fatigue) lowers quality and response rate.
- No closed loop: not contacting detractors wastes the biggest lever against churn.
Calculate and track NPS on your own data
A calculator answers "what is my NPS?" for a moment. A professional NPS program needs more: calculation directly on the raw data, segments at the click of a button, significance, weighting and tracking across every wave. That is exactly what DataLion is built for: NPS is generated as a custom KPI automatically from your survey data, open answers are condensed into drivers via sentiment and topic analysis, and interactive dashboards show the trend in real time.
NPS without spreadsheet gymnastics: DataLion builds your NPS survey, calculates the score live from the raw data and tracks it across every wave – GDPR-compliant and hosted in Germany. See NPS in DataLion or try DataLion for free.