Access profiles
What are access profiles?
Access profiles in DataLion let you individually tailor or restrict how much of the dashboards individual users or user groups can use. For example, the visibility of data sets can be defined per access profile. Access profiles are defined at the project level and can be assigned to one or more users.
How do you create an access profile?
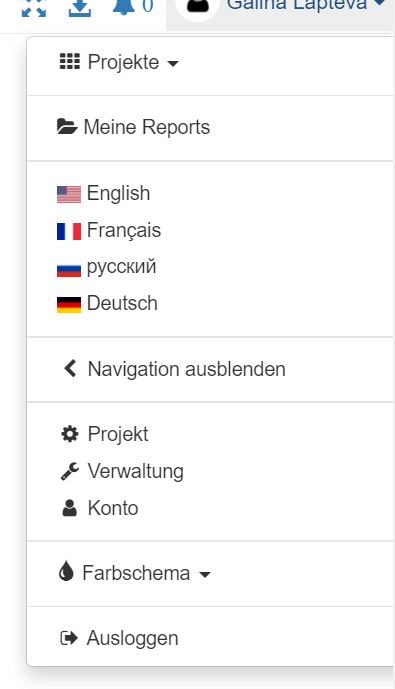
Access profiles are created and edited in the project backend. The project backend is reached via the right-hand navigation (“Project”).
In the “Access profiles” tab, you can create individual access profiles that are assigned to specific users.
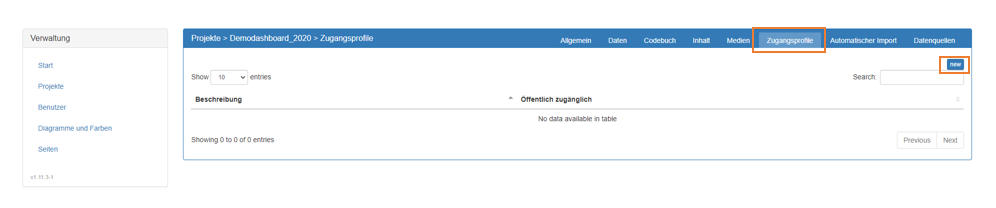
Using the “new” button, you can create a new access profile. In the window that now opens, you can define the properties of the access profile.
What do the individual fields mean?
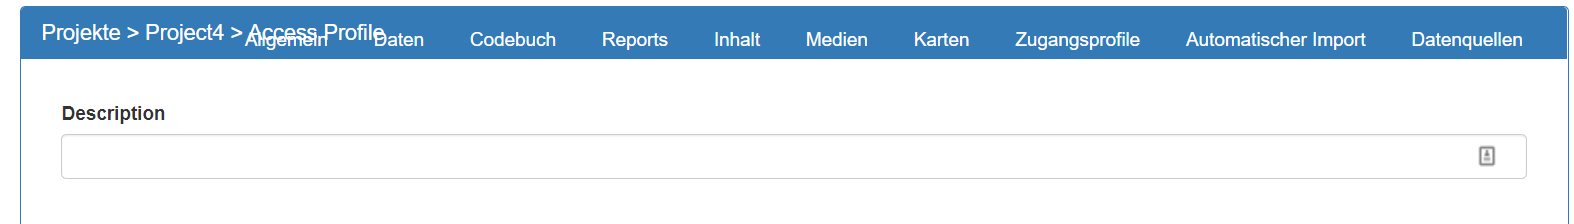
Description
In the “Description” field, you give the access profile a meaningful name so that it can be clearly identified later.
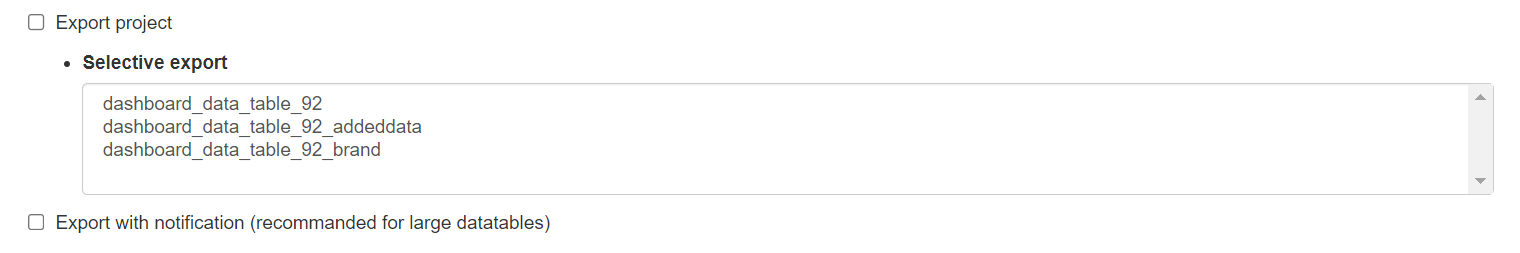
Export project
When the “Export project” checkbox is ticked, users with this access profile can export the project via their user menu on the right-hand side.
In the “Selective export” field, the export permission can be restricted to individual tabs.
When Export with notification is ticked, the data tables are not downloaded immediately; instead the user receives an email with a download link at the email address stored for them in DataLion. Especially for large data tables, an export with notification is recommended.
Disable filters
“Disable filters” hides all filters (e.g. drop-down filters) on the dashboards for the user.

Read mode
Read mode additionally hides the question navigation on the left-hand side of the dashboard. This setting can be further specified via the drop-down field (Configure navigation).
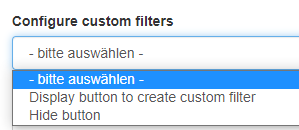
Configure custom target groups
Via “Configure custom target groups”, users of this access profile can be given the option to configure their own target groups via the target group editor in the front end, or this option can be disabled.
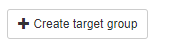
This is the button in the front end being referred to:
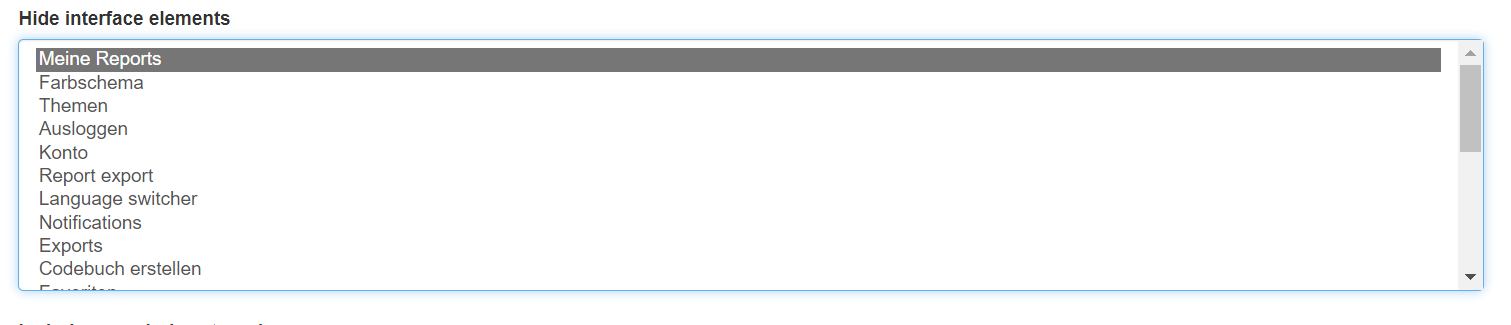
Hide buttons
In the “Hide buttons” field, elements can be hidden from the user menu, such as the “My reports” field or certain export functions.
Include/exclude categories
With the “Include/exclude categories” function, the display of certain question categories in the left-hand navigation area and in the drop-down menus can be enabled or disabled. Using the magnifying glass, individual categories can be selected and then included or excluded.
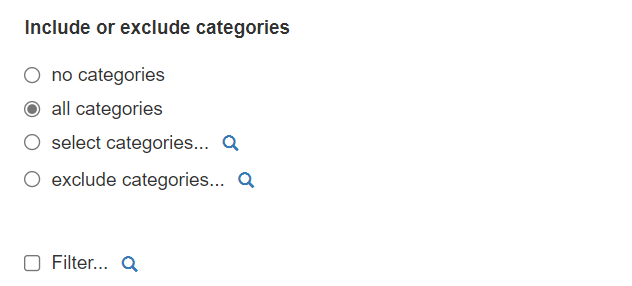
Filter
“Filter” sets a global filter for all users with this access profile. The data is filtered down to the selected category for the access profile. Using the magnifying glass icon, the desired filter category can be selected. To filter on target groups linked with OR, the target group must first be created with the OR link in the codebook and can then be selected via the magnifying glass, e.g. {{‘Marke’ A OR ‘Marke B’}}.
Drop-down filter
Here you can preset drop-down filters for the users, which are then displayed on the dashboards. JSON input is required here - you can generate this by using the filter editor in a dashboard and then opening the “JSON” field, if you do not want to write it by hand.
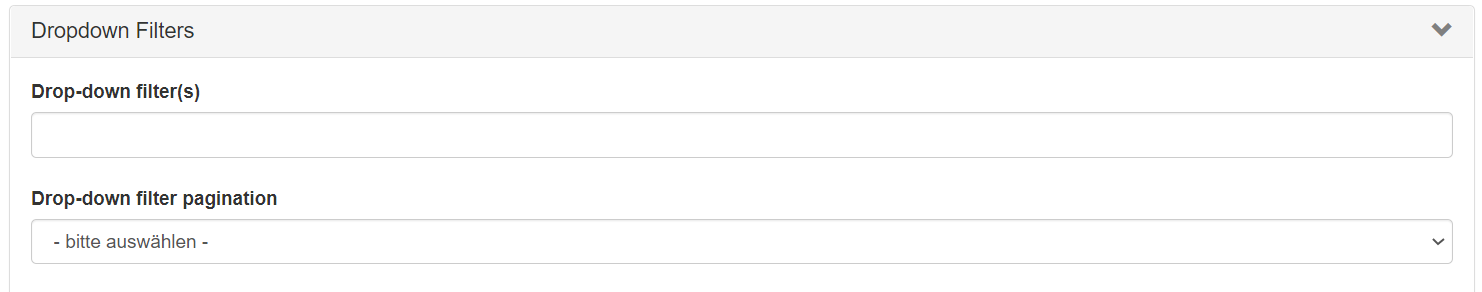
In the Drop-down filter(s) field, the drop-down definition is inserted. The same drop-down menus are displayed on all dashboards for the access profile.
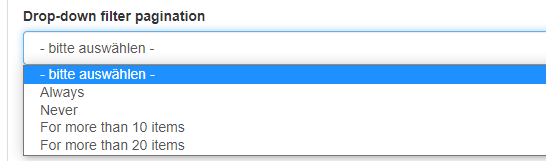
In the Drop-down filter pagination field, you can set whether or under what condition the drop-down menus should include pagination. With pagination, a certain number of items are displayed on one page in the drop-down menu, and there is a search function. Pagination is suitable for drop-down menus with a large number of categories.
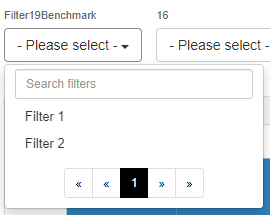
Result, drop-down menu with pagination in the front end:
Items displayed per page
When pagination (see above) is enabled, the “Items displayed per page” setting defines how many items matching the drop-down filter are displayed on each page in the drop-down menu.
Default values for drop-down filters
The “Default values for drop-down filters” setting lets you define a filter default. Detailed information on the drop-down filters can be found here.
Excel report configuration
Access profiles can also be used to configure Excel reports for the users. To do this, insert your code into the “Excel report configuration” field.
An example:
[{“title”: ” Mein Report ”, “ignore_empty_rows”: true, “ignore_empty_columns”: true, “hide_value_labels”: true, “totals”:[{“value”:“n”,“label”:“Total”}], “filter”: [], “columns”: [{“variable_id”: 1}, {“variable_id”: 3, “label”: “Länder ”,“filters”: []}], “rows”: [ {“variable_id”: 3, “label”: “Länder ”,“filters”: []}], “values”: [{“value”: “columnPercent”, “label”: ”%”,“format”: “0%”}] }]
Excel report caching
Enabling Excel report caching speeds up the Excel report for the users, because an Excel report is then kept ready on the server and is updated automatically.
Placeholders
In the “Placeholders” field, placeholders can be enabled for the report. With the “Filter preset for reports” field, presets can be saved.
Share reports with all users in this access profile
Furthermore, you can determine whether the reports should be shared with all users in the relevant access profile.
API settings
In the API settings, you define the parameters required for a data connection via our API interface.
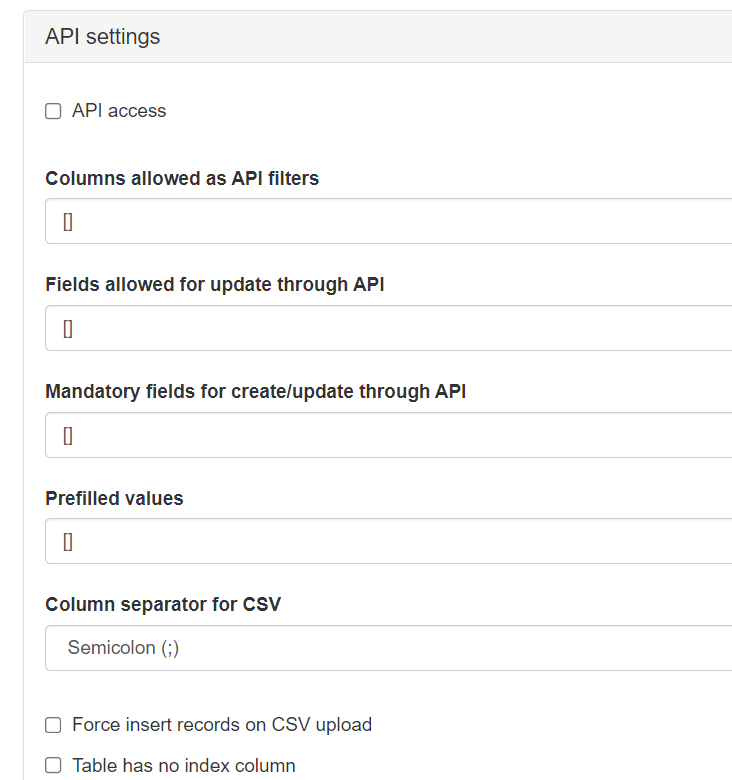
Once you have made the desired settings, you can save the access profile and assign it to specific users.