
Analyze open answers: sentiment and topics
Open answers often hold the most useful hints but take a lot of effort to analyze. Text analytics assigns each answer a sentiment and a topic. The results land in the dataset as new variables and then work like any other question: in charts, filters, crosstabs and exports. DataLion also creates a report with two charts.
Requirements
- DataLion release 2026.2.192 or later.
- An administrator account.
- Built-in AI is switched on and approved for processing response data. Without the approval, the form shows a notice and Run analysis stays disabled. The AI settings are under Admin → Integrations, and an administrator sets up the approval for response data.
- A dataset from a DataLion survey. The analysis needs a row identifier (
id), which imported files usually don’t have.
Run the analysis
- Open the project under Admin → Projects and go to the Codebook.
- In the Tools section, click Analyze open text. The Text analytics page opens.
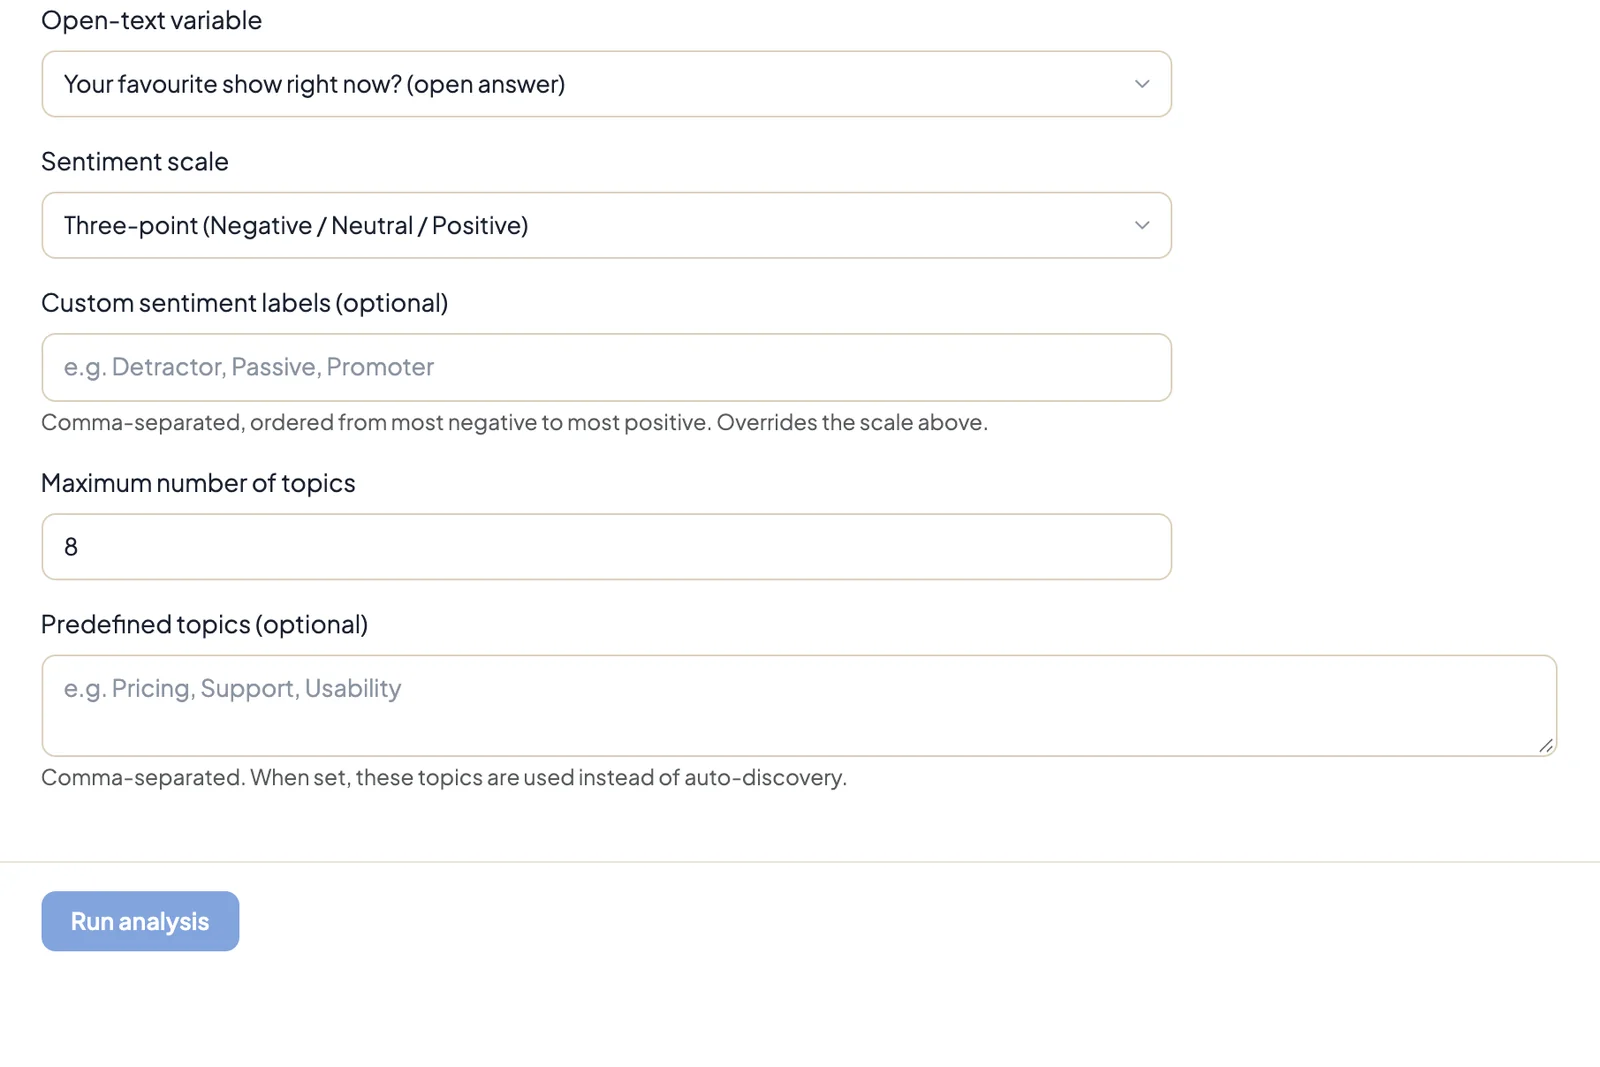
- Under Open-text variable, pick the question with the open answers.
- Choose the Sentiment scale: binary (negative, positive), three-point (negative, neutral, positive) or five-point. Three-point is the default. With Custom sentiment labels (optional) you replace the level names, for example with “Critical, Neutral, Positive”. Order them from negative to positive.
- Under Maximum number of topics, set how many topics DataLion creates at most, between 1 and 8.
- If you already know the topics, enter them comma-separated under Predefined topics (optional), such as “Price, Service, Usability”. The AI then assigns each answer to one of these topics instead of finding its own.
- Click Run analysis.
Progress shows how far it has got. The analysis can take a few minutes. When it’s done, you’ll see “Done — … responses analyzed.” with an Open the report link.
What the analysis creates
For a question with the variable name comment, three new variables are created:
comment_sentiment: the sentiment as a categorycomment_sentiment_score: the sentiment as a number from −1 to 1, or −2 to 2 on the five-point scalecomment_topic: the topic. Answers that don’t fit any topic go to “Other”.
In the codebook the variables sit in the “Text analytics” folder, each with “(AI-classified)” in its name. The new report is called “Text analytics: …” and shows sentiment and topics as bar charts side by side.
Limits
- Each run analyzes up to 5,000 answers. DataLion skips empty answers and classifies identical answers only once.
- If you run the analysis again, DataLion replaces the three variables. Each run creates a new report, and old reports stay.
- The classification comes from an AI. Check a sample of answers and their topics before you report the results.
Tips
- Start with few topics, around five. Too many topics spread the answers so thinly that individual bars say little.
- Predefined topics make results comparable across waves, because every wave gets the same categories.
- For an overview of frequent terms, a wordcloud also helps, see Available chart types.