
Conjoint analysis: set up the question and simulate preferences
A conjoint analysis tells you which features of an offer drive choice and what customers would pay for better features. In DataLion the whole path runs in one tool: you add the conjoint question to the questionnaire, DataLion generates the design, respondents choose between offers, and the results dashboard shows importance, part-worth utilities and a preference simulator.
Requirements
- DataLion release 2026.2.192 or later.
- An administrator account to create the survey.
- The analysis only works for conjoint questions from a published DataLion survey. DataLion uses its R environment for the estimation.
Create the conjoint question
The quickest start is the Conjoint Analysis: Product Preferences template in the Market & brand category, see Create a survey from a template. Or add a question of type Conjoint analysis in the builder.
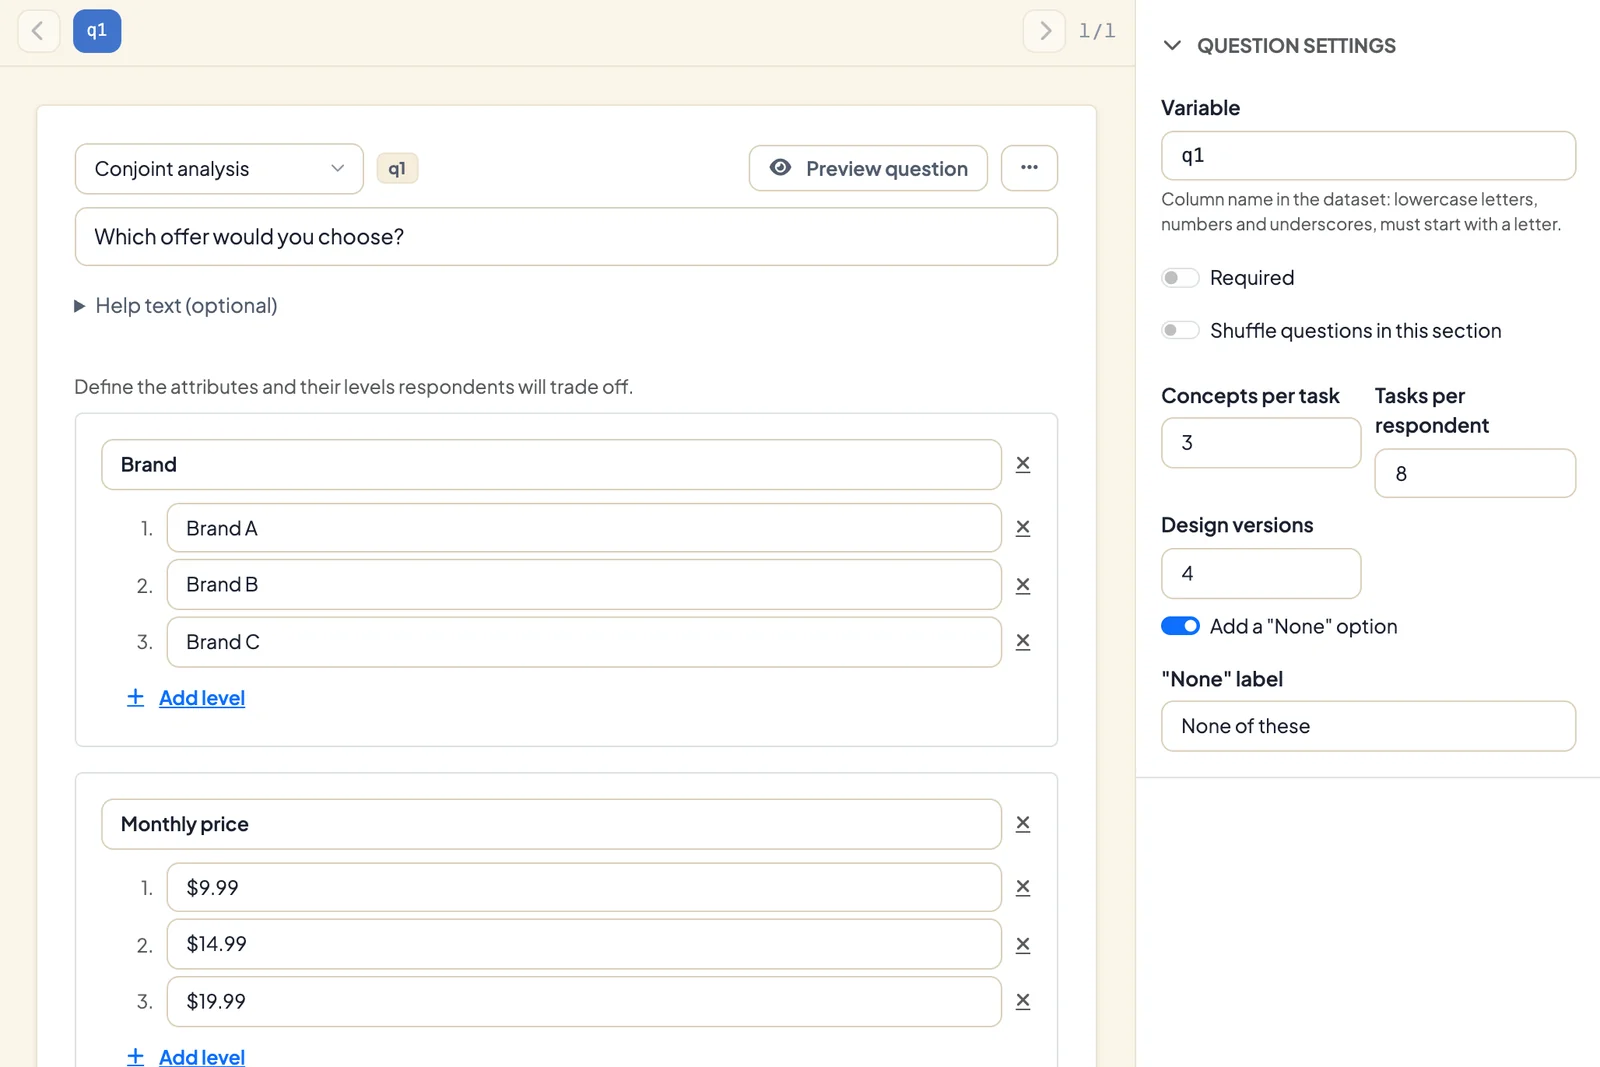
- Enter the question text, for example “Which offer would you choose?”.
- Add the attributes, such as brand, monthly price, feature set and cancellation terms. Add attribute adds another one, Add level adds a level within an attribute.
- In the Question settings on the right, set:
- Concepts per task: how many offers appear side by side per choice, 2 to 6, default 3
- Tasks per respondent: how many choices each person makes, 1 to 30, default 8
- Design versions: how many different questionnaire versions there are, 1 to 12, default 4
- Add a “None” option: respondents may reject all offers. You set the “None” label yourself.
DataLion generates the experimental design automatically, balanced and randomized for each version, and hands the versions out to respondents in turn. If you change attributes or levels, DataLion rebuilds the design. Respondents see “Task 1 of 8 — pick your preferred option” and choose an offer with a click.
Analyze the results
Once published, the results dashboard contains a chart for the conjoint question. As soon as there are enough responses, DataLion estimates the model. Until then the chart says “Not enough responses yet to estimate results.”
In the chart menu (gear), choose the view under Conjoint:
- Attribute importance (default): how strongly each attribute drives the choice, in percent. The values add up to 100.
- Part-worth utilities: the utility of each level. The first level of each attribute is the reference with a value of 0.
Under Display, switch between Bar chart, Table, Pie chart and Preference simulator.
Simulate preferences
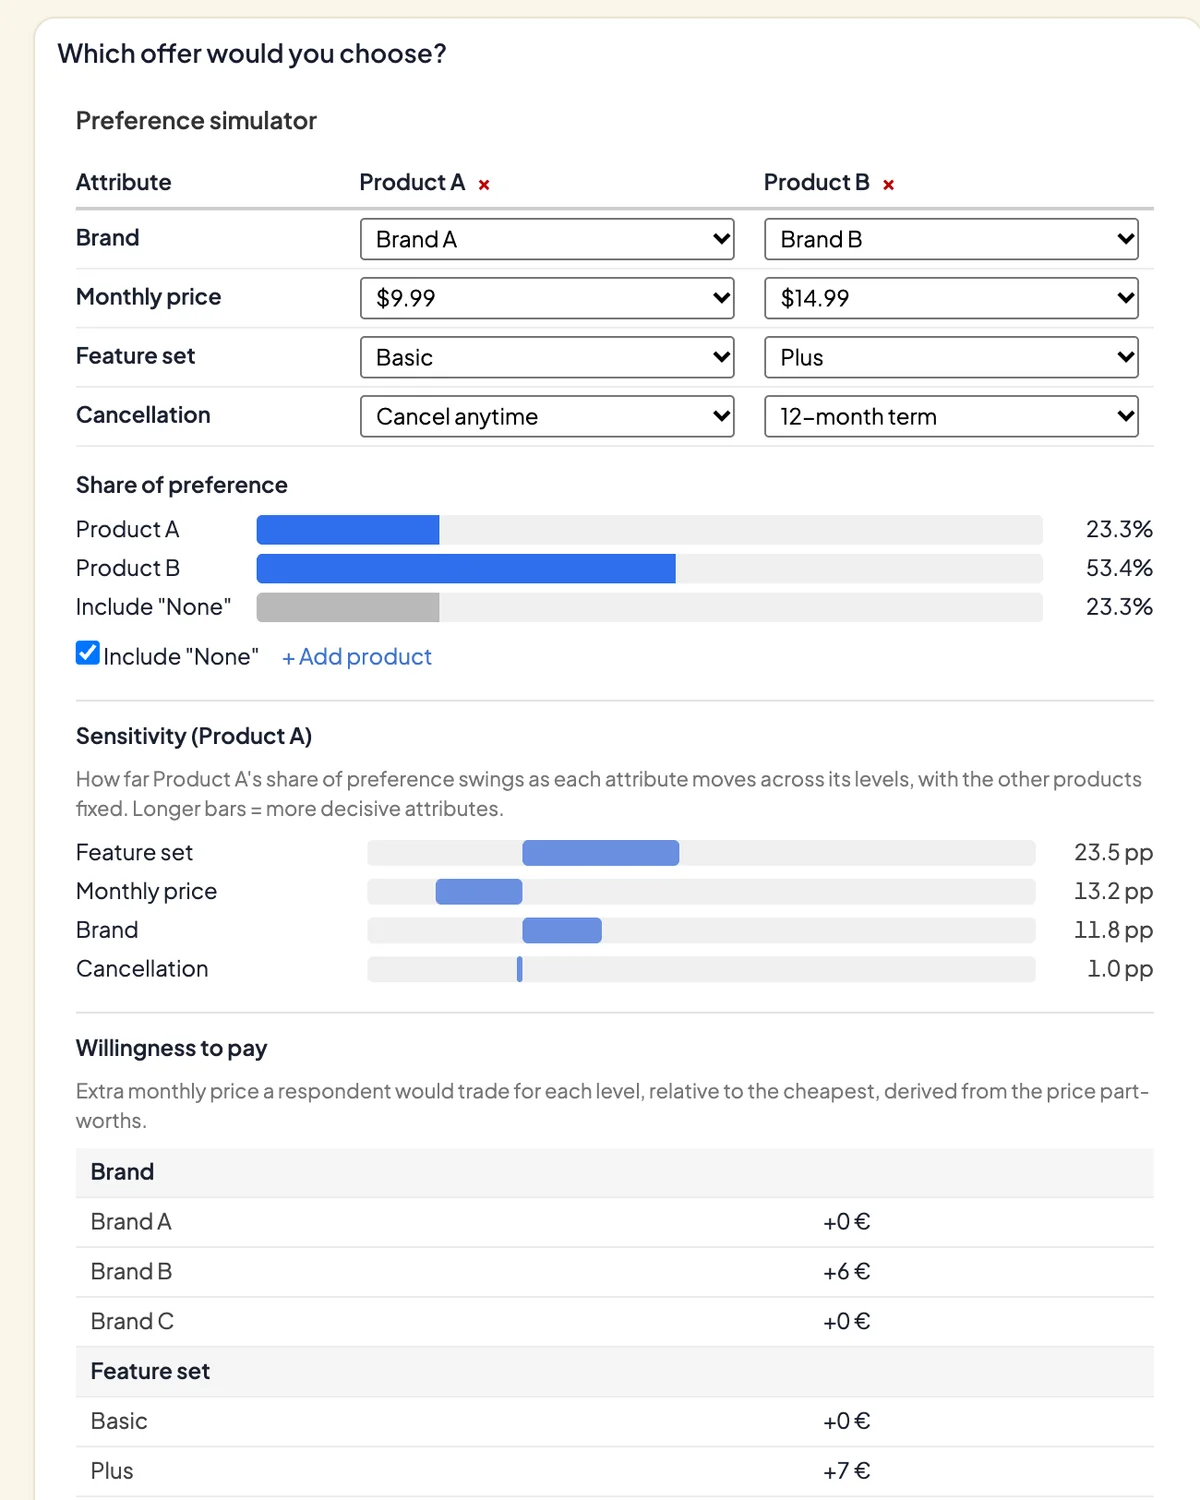
In the Preference simulator you put offers together and see what share of choices each would get.
- For Product A and Product B, pick a level in each row.
- + Add product compares further offers, × removes one.
- The shares appear under Share of preference. With Include “None”, DataLion accounts for the option of choosing none of the offers.
Below that, Sensitivity (Product A) shows by how many percentage points Product A’s share moves when an attribute runs through all its levels. Long bars mark attributes that strongly influence the choice.
Willingness to pay
If the conjoint question has a price attribute, the simulator shows under Willingness to pay the extra monthly price respondents would accept for each level, compared with the cheapest.
DataLion detects the price attribute automatically. It needs a name such as “price”, “monthly price”, “cost” or a currency symbol, at least two levels with numbers, such as “$9.99” and “$14.99”, and results in which a higher price is less popular. Without such an attribute, the simulator says “Add a price attribute to estimate willingness to pay.” DataLion shows the values in euros.
Compare subgroups
Under Compare subgroups in the chart menu, pick a single-choice question from the same survey, such as “Do you currently use a comparable subscription?”. DataLion then shows the importance per group next to a Total column, each with its case count. Small groups give unstable estimates. A dash means the model couldn’t be estimated for that group.
How DataLion calculates
DataLion estimates an aggregate multinomial logit model across all respondents. An attribute’s importance is the range of its part-worths relative to the sum of all ranges. DataLion doesn’t calculate individual part-worths per person, as hierarchical Bayes methods do.
Tips
- Keep the design manageable: three to five attributes with two to four levels each. More attributes need noticeably more respondents.
- As a rule of thumb, stable results need a few hundred complete responses. Test the survey first with Test survey.
- For ranking many features without a price component, MaxDiff is often the better fit.