
Create dashboard filters (dropdown filters) with JSON - advanced options
Standard and benchmark dropdown filters
A filter dropdown menu can be integrated into a report so that users can “play” with the data and quickly filter for different target groups.
How to create dropdown filters

Step 1: Create a report or select a saved report
Step 2: Open the report settings
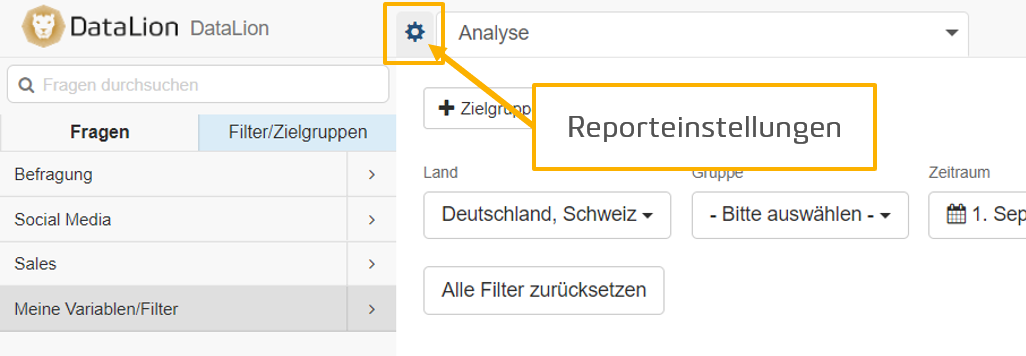
Step 3:
A defined filter dropdown menu can be set for each tab. To do this, a kind of code has to be written that must be saved in the respective tab selection.

Step 4: Create the code
Example:
[{“name”: “Country”, “color”: “#fff”, “filter”: 431, “multiple”: true},{“reset”: “Reset all filters”}]
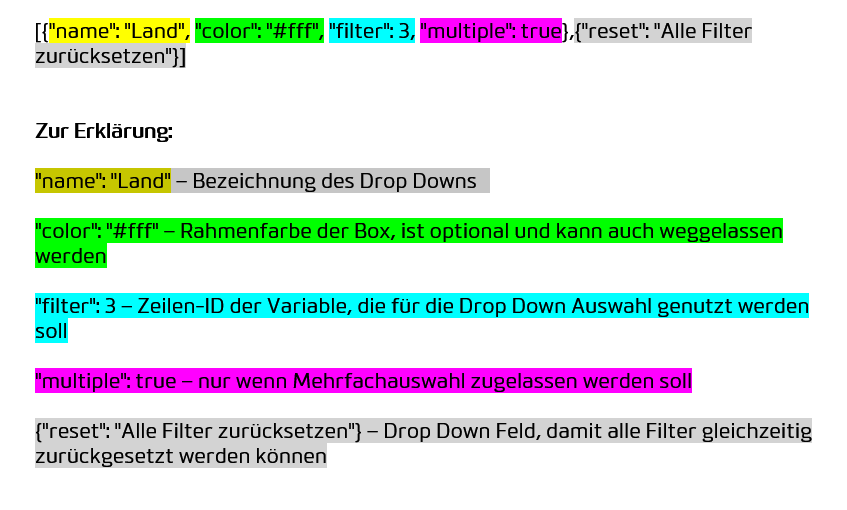
Any number of filter dropdowns can be strung together, for example:
[{“name”: “Country”, “color”: “#fff”, “filter”: 3, “multiple”: true},{“name”: “Group”, “color”: “#fff”, “filter”: 7},{“name”: “Gender”, “color”: “#fff”, “filter”: 10}, {“name”: “Age”, “color”: “#fff”, “filter”: 16, “multiple”: true }, {“name”: “Social Media”, “color”: “#fff”, “filter”: 352, “multiple”: true }, {“reset”: “Reset all filters”}]
The code turns red if it is not formatted correctly.
Dropdown definition: further options for the dropdown menu
Multiple selection:
The values selected in the dropdown menu are combined with OR and the total value is displayed.
Example:
[{“name”: “Country”, “filter”: 431, “multiple”: true}, {“reset”: “Reset all filters”}]
Result: A total value across all selected countries (country = country1 OR country2 OR country3, …) is calculated.
Setting a default filter
You can set a default filter that is selected by default when the dashboard is opened. To do so, add “default” : row ID to the code.
Example:
[{“name”: “Country”, “filter”: 431, “default”: 432}]
Especially with benchmark filters, it can make sense to set several values of a filter variable as the default. This is also possible:
[{“name”: “Country”, “filter”: 431, “type”:“benchmark”, “default”: “432,433”}]
Default values can be deselected by users in the dashboard. As soon as no value is selected any more, the default value is displayed again.
Note: default values that apply across dashboards for a particular variable (e.g. the current year and month) can be defined in the codebook for all dashboard filters based on this question. You can find the instructions here.
Carrying dropdown filters over to another dashboard with default filters
Optionally, the active dropdown filters can override the default filters on other dashboards. This behavior can be activated with the option “Selected filters will override default filters” in the report settings.

Dummy dropdown value (no filtering)
With “include_all”: true, an additional value “ALL” is displayed in the dropdown menu. With include_all: “NAME”, the filter value is called NAME.
This dropdown value is evaluated as TRUE in all calculations. This means that no filtering takes place.
“include_all”: true can be used, for example, to offer the option of deselecting a default dropdown value without setting another filter.
[{“name”: “Country”, “filter”: 431, “default”: 432, “include_all”: “All values”}]
Showing only the search field
With “search_only”:true, no values are shown in a dashboard dropdown filter, only a search field. Values are only displayed once the search is active. This is particularly useful if a dropdown has a very large number of options.
[{“name”: “Country”, “filter”: 431, “search_only”:true}]
Benchmark dropdown
Every value selected in the dropdown menu is displayed as a separate column/row (target group split).
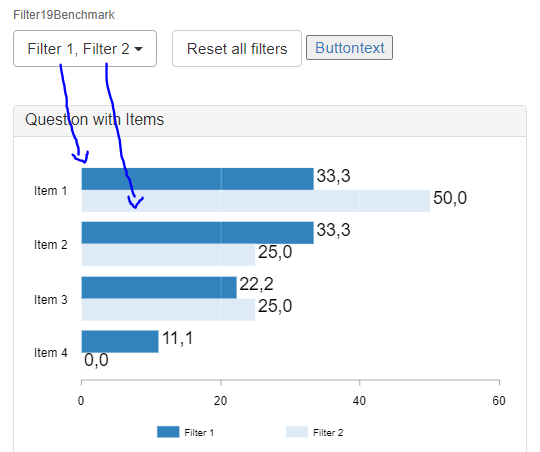
Example dropdown definition:
[{“name”: “Country”, “filter”: 431, “type”: “benchmark”}, {“reset”: “Reset all filters”}]
Result: Each country is displayed as a separate column/row (target group split).
Dropdown filters of the type “Benchmark” can also be created with multiple selection (“multiple”:true). In this case, just as with the standard dropdown filter, the individual selected values of the dropdown menu are combined with OR and the total value is inserted into the charts as one column/row. If you create a second benchmark dropdown filter, the selection of this filter is inserted into the charts as the second/third/… column/row.
[{“name”: “16benchmarkmultipletrue”, “filter”: 16, “multiple”: true, “type”:“benchmark”,“multiple”:true},{“name”: “19benchmarkmultipletrue”, “filter”: 19, “type”:“benchmark”,“multiple”:true}]
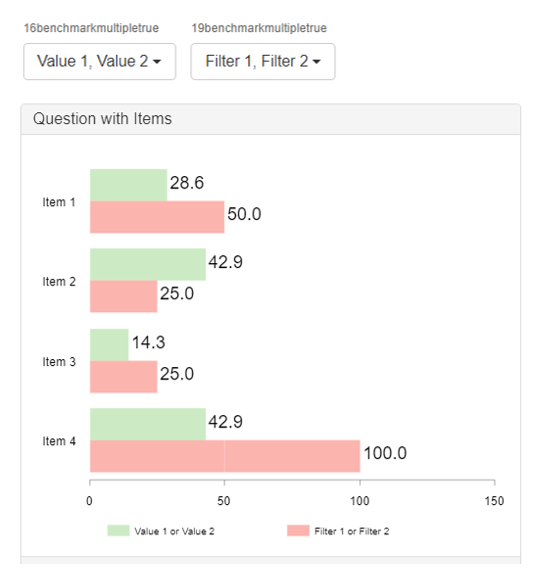
Please note**:** Benchmark filters (bm) and benchmark subfilters (bms) are indexed according to their order in the dropdown definition of a dashboard, starting at 0 (e.g. bm_0, bm_1, bm_2, and so on). All objects {} in the dropdown definition (including the non-benchmark filter objects, e.g. also {“delete”: xx}) are part of the order of the dropdown definition.
If you want to carry active bm and bms filters over when switching to another dashboard, the same filter objects must also be defined on the target dashboard, and they must be defined in the same order as on the original dashboard.
Using benchmark dropdown filters as subfilters in tables
The chart type “Datatable” is the only chart in DataLion with the option of defining filters as “subfilters”. This creates a chart header with two levels. These double-header tables can also be created with dropdown filters. When using dropdown filters of the type “Benchmark” with the additional parameter “datatable”:“subfilter”, the values selected in the dropdown menu are not inserted as filters but as subfilters in charts of the type “datatable” (table chart).
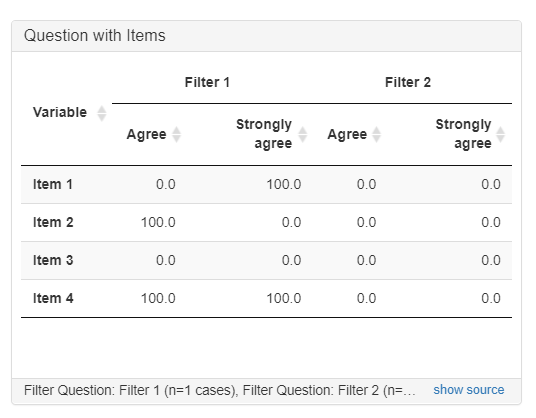
Example dropdown definition:
[{“name”: “Sub-benchmark filter”, “filter”: 19, “type”: “benchmark”, “datatable”: “subfilter”}]
Not transferring the benchmark filter selection across tabs when exporting reports to Excel
When exporting reports to Excel, the filter selection of the current dashboard is applied to all dashboards by default. If this is not desired, a “clear”: true can be added to the dropdown definition.
[{“name”: “Country”, “filter”: 431, “type”: “benchmark”, “clear”:true}]
Dropdown menu with the target groups from the target group editor
Dropdown menus can now also be created for target groups from the target group editor. To do this, the parameter “filter”: “user” is set in the dropdown definition.
Example dropdown definition:
[{“filter”: “user”}]
Defining the base display in tables via a dropdown menu
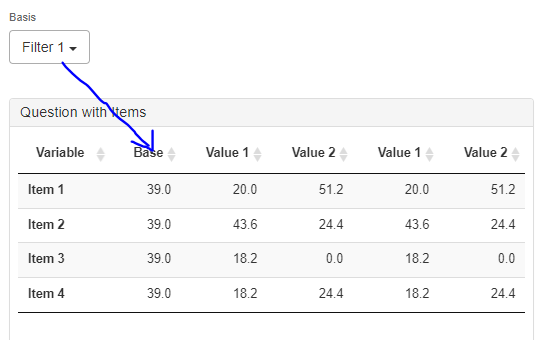
Using the dropdown menu with the parameter “type”: “base”, you can determine which value is displayed in the “Base” column in the table chart type.
Example dropdown definition:
[{“name”: “Base”, “filter”: 19, “type”: “base”}]
Showing only certain values of a filter variable in the dropdown menu
To display only a selection of the values of a variable in the dropdown menu, the parameter “filter” is defined per value within the “values” object.
Example:
[{“name”: “Country”, “values”: [{“name”:“Country1”,“filter”: 20},{“name”:“Country3”,“filter”: 22}]}]
Limiting the number of values that can be selected
To define the maximum number of values that can be selected in a dropdown menu, the parameter “max_values”: n is added to the dropdown definition.
[{“name”: “Country”, “filter”:19, “multiple”:true, “max_values”:2}]
Not carrying dropdown filters over when switching to another dashboard
By default, the selected dropdown filters of a dashboard are carried over when switching to another dashboard of the report. This can be prevented as follows:
Option 1: Generally prevent the dropdown filter selection from being carried over across the dashboards of a report
In the report settings, at the very bottom under Options, tick “Apply filters only to current tab” and save.

Option 2: Define whether a particular dropdown filter is carried over when switching dashboards
To do this, add the information “scope”: “tab” (or, if applicable, “scope”: “report”) to the code of the filter.
“scope”: “tab” —> The filter is not carried over when switching to another dashboard of the report.
“scope”: “report” —> The filter is carried over when switching to another dashboard of the report.
Example:
[{“name”: “Country”, “filter”: 431, “scope”: “tab”}]
Deleting a particular dropdown filter on a dashboard
Generally disallowing a particular dropdown filter on a particular dashboard: If a dropdown filter should not affect a certain dashboard at all, this can be done with the parameter “delete” in the dropdown filter code of the dashboard.
Example:
[{“delete”: [“5”,“18”]},{“name”: “Country”,“filter”: 431}]
CAUTION!
-
The “delete” command must always be written with a [list], even if only one value is to be deleted:
"delete": ["5","18"] -
The same value must never be set as both a default value and a value to be deleted
On the dashboard with this code, the dropdown filters with Row_ID 5 and 18 are reset automatically.
Use the Row_ID of the codebook question to have all values of this codebook question deleted from a dashboard, or use the Row_ID of an individual value to have only this value deleted.
Datepicker (time series menu)
For time series analyses, a dropdown field for selecting the time window can be integrated.
Example:
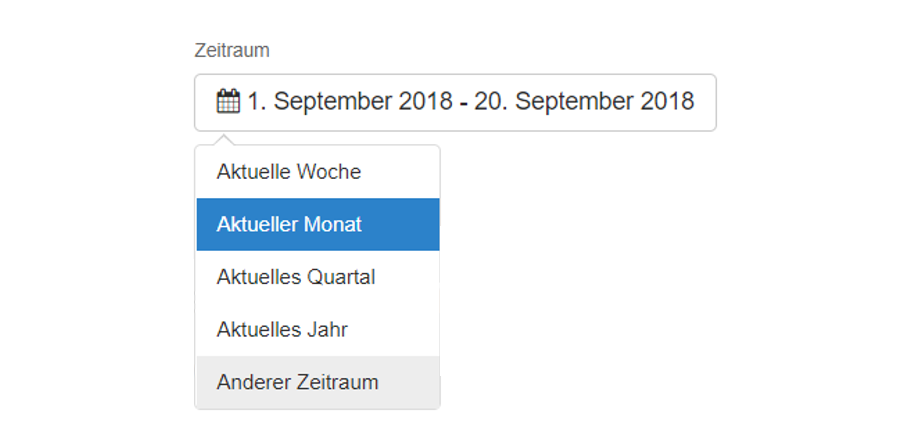
Example:
[{“name”: “Period”, “date”: true, “ranges”: [“currentWeek”, “currentMonth”, “currentQuarter”, “currentYear”]}, {“reset”: “Reset all filters”}]
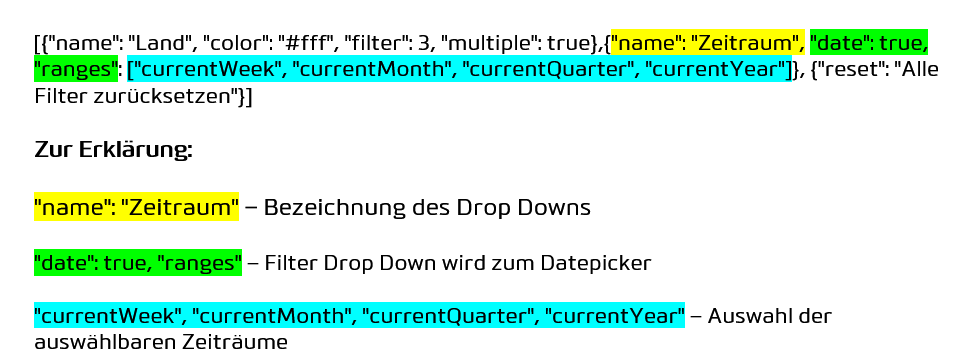
Possible periods (definition of the labels): “ranges”
today: “today”
yesterday: “yesterday”
last 7 days: “7days”
30 days: “30days”
current week: “currentWeek”
last week: “lastWeek”
current month: “currentMonth”
last month: “lastMonth”
current quarter: “currentQuarter”
last quarter: “lastQuarter”
current year: “currentYear”
last year: “lastYear”
all data: “all”
Possible default settings: “date”
“minimumDate”: Defines the earliest date that can be output.
Example:
“minimumDate”: “2016-01-01” <- sets the start date to 1 January 2016 when the entire period is selected.
“maximumDate”: Defines the latest date that can be output.
Example:
“maximumDate”: “2016-01-01” <- sets the end date to 1 January 2016 when the entire period is selected.
With the addition “maximumDate”: “today”, the current day is included in the period “all”.
Example:
[{“name”: “Period”, “date”: true, “time”: true, “maximumDate”: “today”, “ranges”: [“all”,“currentWeek”, “currentMonth”, “currentQuarter”, “currentYear”]}, {“reset”: “Reset all filters”}]
“defaultRange”: Defines the period that is selected when you open the dashboard anew. If the option is omitted, the last week is selected. All periods listed above under “Possible periods” can be set as the default.
Example:
“defaultRange”: “all” <- sets the initial default setting to the entire period
Example: {“name”: “Date”, “date”: true, “defaultRange”: “all”, “minimumDate”: “2017-03-01”,“ranges”: [“all”,“currentMonth”, “currentQuarter”, “currentYear”]}, {“reset”: “Reset all filters”}]
Datetimepicker
With “time”: true, a time of day can also be selected in the datepicker (datetimepicker).
Note! If the display on the dashboard does not change after a subsequent change to the datepicker, click “Delete time filters” at the very bottom of the report settings. This resets the filters.