Handling missing values
Handling missing values in data is central to analysis. Some missing values you want to see in your analyses, others you do not. Some missing values should be taken into account when calculating proportions, others should be excluded.
DataLion provides extensive handling of missing values. Missing values, as well as their inclusion in or exclusion from calculations, can be defined at the project level (in the backend) and at the question level (in the codebook; see below).
Important: When defining missings in the backend and in the codebook, the setting in the codebook takes precedence.
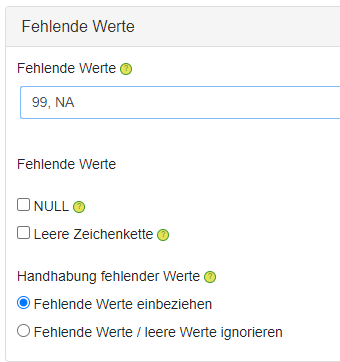
In the backend, the following settings can be defined as the default for an entire project:
-
Values that should be treated as missing values (user-defined values as well as NULL and empty strings)
-
Handling of missing values (whether these should be included in the total count for a calculation by default, or whether these values should be ignored for calculations)
Example: if “99” is defined as a missing value and it is ignored in calculations, then …
-
all entries with “99” are not taken into account when calculating a sum or a mean.
-
when determining percentages, the percentage is calculated exclusively on the values that are not “99”.
Use case:
A typical use case in which missing values should (or should not) be included in the calculation of sums/means or percentages is with filter questions in surveys.
Example: Satisfaction with a product is only rated by people who previously stated that they know the product. Those who stated that they do not know the product have missing values for the satisfaction question.
-
Now it can be interesting to find out how satisfied those people are who know the product (satisfaction exclusively of those who know the product → missing values are not taken into account)
-
Or to find out how many of all respondents are satisfied with the product (satisfaction of those who know the product, but in relation to all respondents → missing values must be taken into account in the percentage calculation)
Illustration (means):
-
Missing values for Q1: 0 → if 0 is included in the calculation, the mean is biased downward and the case count is higher)
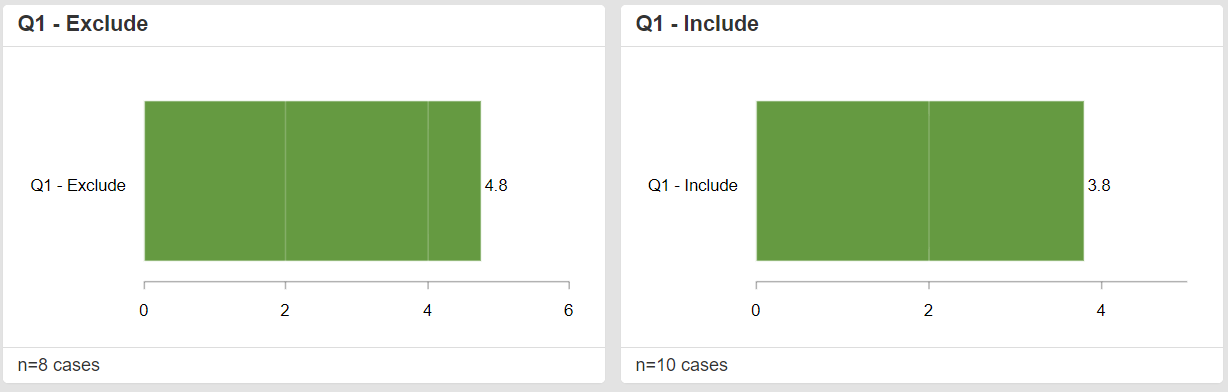
-
Missing values for Q2: 99 → if 99 is (incorrectly) included in the calculation, the mean is biased upward and the case count is larger)
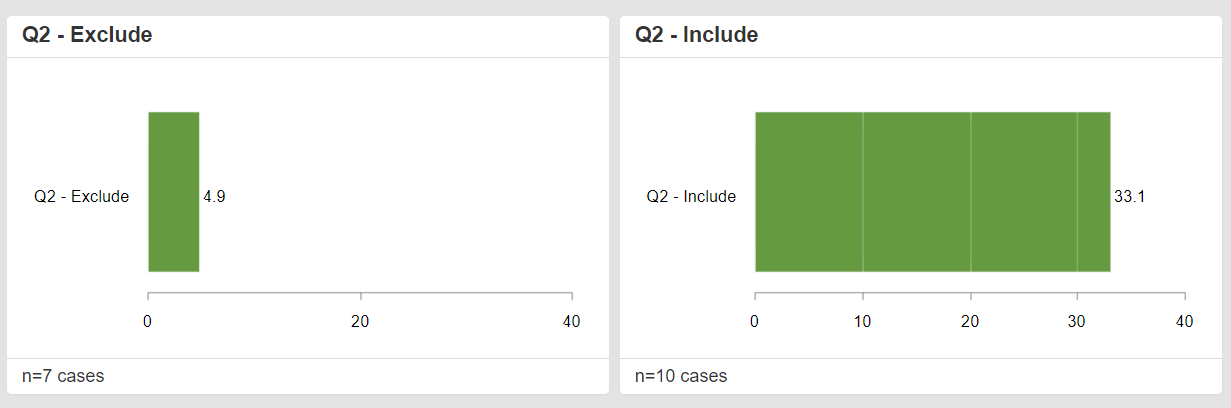
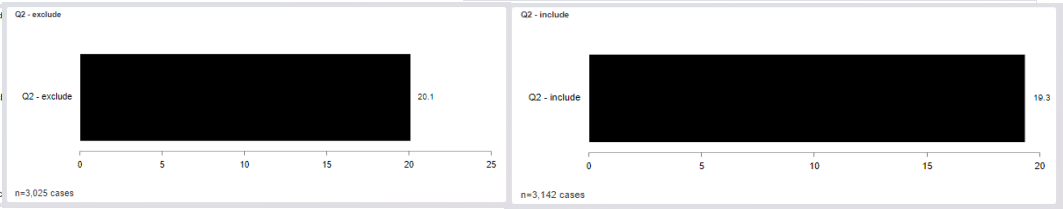
Illustration (percentages):
- Missing values for Q2: 99 → if 99 is excluded from the calculation of percentages, the case count is lower (only those who know a product) and the percentage is higher.
If 99 is taken into account in the calculation of percentages, the case count is higher (all respondents) and the percentage is lower.
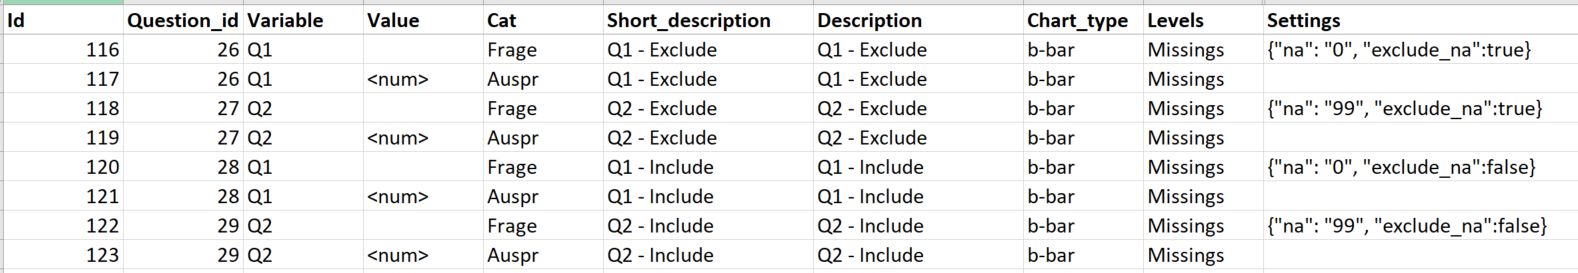
Settings in the codebook
In the codebook, the following options can be added question-specifically in curly braces in the “Settings” column (note: this overrides project settings):
-
Define missing values differently from the project:
{“na”: “missingValue1”} or {“na”: “missingValue1”, “missingValue2”, “etc.”} -
Exclude missing values: {“exclude_na”:true}
→ values defined as missing are not taken into account in the total count when determining percentages -
Include missing values: {“exclude_na”:false}
→ values defined as missing are taken into account in the total count when determining percentages
Multiple settings can be combined, separated by a comma, e.g.
{“na”: “missingValue1”, “exclude_na”:false}