
Citizen Survey for Municipalities
Anonymous citizen survey on satisfaction with municipal services and local quality of life – a sound basis for decisions in the council and administration.
The live demo opens the real questionnaire — no signup required.
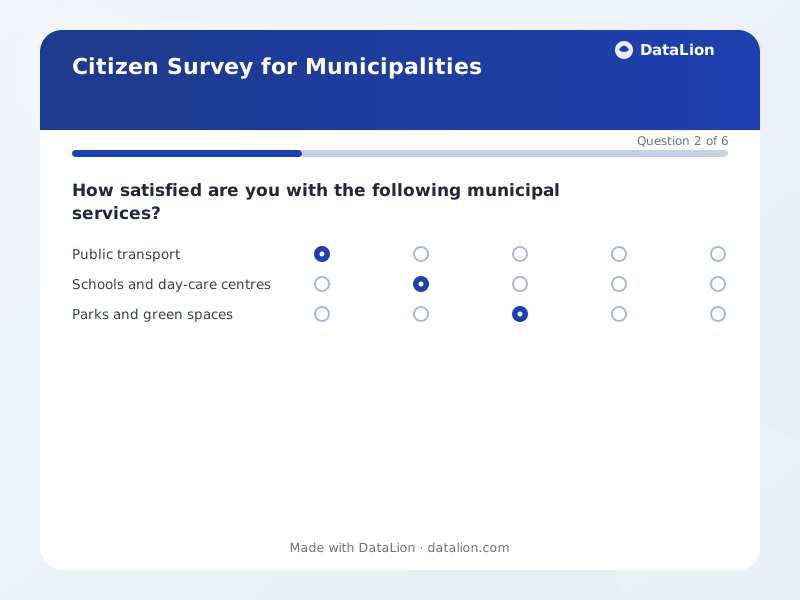
With this template, municipalities gather structured feedback from their residents. The survey combines a satisfaction matrix on key municipal services with an assessment of overall quality of life and a prioritisation of future investments. It is deliberately anonymous to encourage honest and representative answers.
When should you use this template?
This template is a great fit for:
- As a recurring citizen survey on town development
- To prepare budget and investment decisions
- Before and after major municipal projects
- As a participation building block in an integrated urban development strategy
- To continue a citizen barometer as a multi-year comparison
Every question in this template
- 1Matrix
How satisfied are you with the following municipal services?
Please rate each area.
Very dissatisfied Dissatisfied Neutral Satisfied Very satisfied Public transport Schools and day-care centres Parks and green spaces Safety in public spaces Administration and citizen services - 2Single choice
How would you rate the overall quality of life in our municipality?
- Very poor
- Poor
- Average
- Good
- Very good
- 3Ranking
Which areas should take priority for future investment?
Please put the areas in order – the most important first.
- 1Public transport
- 2Education and childcare
- 3Green spaces and climate protection
- 4Safety and public order
- 5Digitalisation of administration
- 6Housing
- 4Single choice
Which age group do you belong to?
- Under 18
- 18–29
- 30–44
- 45–59
- 60–74
- 75 and older
- 5Single choice
In which district or quarter do you live?
Please adapt this list to the districts of your municipality.
- Town centre
- North
- East
- South
- West
- 6Long text
From your perspective, what should we improve first in our municipality?
From questionnaire to dashboard
Six questions turn into the analysis the council and the administration actually need, broken down by district and age group:
- Quality of life as the headline metric: The share of positive ratings for overall quality of life as a KPI tile – the single number that stays comparable across electoral terms and belongs in every council paper.
- Satisfaction per service as a polarity chart: The satisfaction matrix as a polarity chart: approval and criticism run against each other from a shared centre. You can see at a glance which municipal service is holding up and which is tipping – far clearer than any ranking of means.
- Investment priorities of residents: The ranking question becomes a sorted priority list for the budget discussion. The revealing part is comparing it with the satisfaction matrix: areas rated poorly and ranked highly at the same time are the real fields for action.
- District heatmap: Services in the rows, districts in the columns: the heatmap immediately shows where dissatisfaction is locally concentrated rather than evenly spread – the view that turns a citizen survey into a basis for concrete local action.
- Comparison across generations: The same priorities stacked by age group. Young families and older residents rate public transport, childcare and accessibility very differently – an overall figure hides exactly the trade-off that has to be decided politically.
- What should be improved first: The open-ended responses are condensed into topics automatically and given a sentiment. A rating of medium satisfaction with public transport turns into a concrete point about weekend frequency – the level at which an administration can actually act.
Go deeper
Related survey templates
- Participatory BudgetingInvolve your residents in allocating municipal funds – with project prioritisation and a transparent distribution of the budget.
- Volunteer SurveyAnonymous survey of your volunteers on recognition, support and sense of purpose – so that volunteering is sustained and supported over the long term.
- Member Survey (association, chamber, guild)The member survey for trade and professional associations: satisfaction with and importance of services, advocacy, topic wishes, channels, recommendation and intention to cancel.
- Association Member SurveyAnonymous survey of your association or club members on offerings, communication and participation – so you know what matters to your members.
Frequently asked questions
Is the citizen survey anonymous?
Can I adapt the questions to my municipality?
How do we get a good response rate?
Is analysing results by district compliant with data protection rules?
How do we publish the results to the council and the public?
How many responses do I need for meaningful results?
Start with this template
Load the template into DataLion, adapt it to your brand and start collecting responses — GDPR-compliant, in minutes.