
Business Climate Survey (association, chamber, economic development)
The classic business climate survey: current situation, expectations, order books, investment, employment and risks – as a time series per sector and company size, with the balance as a computed metric.
The live demo opens the real questionnaire — no signup required.
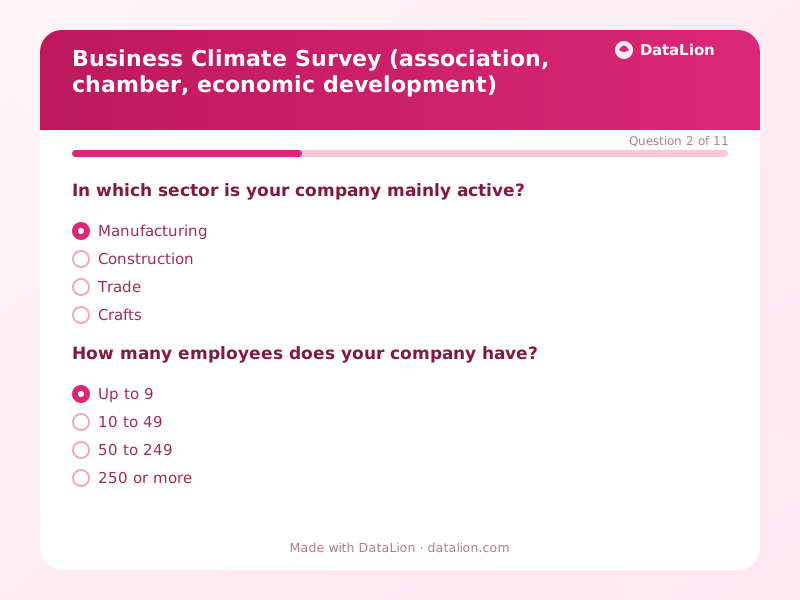
The business climate survey is the product that gets an association or chamber into the press. And it is almost always manual work: returns in Excel, a balance of "good" minus "poor" by formula, a time series in a file only one person understands. This template adopts the proven question set of the ifo and DIHK surveys: situation, expectations, orders, investment, employment, capacity, plus the risk list. In DataLion each wave is appended to the same dataset, the balance is a computed metric, and the time series per sector comes from the wave field on its own. The report for the press conference is then a PowerPoint export in your layout.
When should you use this template?
This template is a great fit for:
- Quarterly or twice a year as the association's business climate report
- Via link in the member newsletter, with a URL parameter per section or region
- As a flash survey on an acute topic (energy prices, supply chains) using the same skeleton
- As the data basis for press releases and policy papers
Every question in this template
- 1Single choice
In which sector is your company mainly active? *
- Manufacturing
- Construction
- Trade
- Crafts
- Services
- Hospitality and tourism
- 2Single choice
How many employees does your company have? *
- Up to 9
- 10 to 49
- 50 to 249
- 250 or more
- 3Single choice
How do you assess your company's current business situation? *
- Good
- Satisfactory
- Poor
- 4Single choice
How has your business situation changed compared with last year?
- Better
- Unchanged
- Worse
- 5Single choice
How will your business situation develop over the next twelve months? *
- More favourable
- Unchanged
- Less favourable
- 6Single choice
How do you assess your current order backlog?
- Above normal
- Normal
- Below normal
- 7Single choice
What is your current capacity utilisation?
- Below 70%
- 70 to 85%
- 85 to 95%
- Above 95%
- 8Single choice
How will your domestic investment develop over the next twelve months?
- Higher
- Unchanged
- Lower
- No investment planned
- 9Single choice
How will your headcount develop over the next twelve months?
- Increase
- Stay the same
- Decrease
- 10Multiple choice
What do you see as the biggest risks to your company's economic development?
Multiple answers possible.
- Domestic demand
- Foreign demand
- Skills shortage
- Labour costs
- Energy and raw material prices
- Economic policy conditions
- 11Long text
What is your company most concerned about at the moment?
From questionnaire to dashboard
The questionnaire produces the interactive business climate report:
- Climate, situation and expectations as a time series: The balances across all waves as lines, filterable by sector. The chart that goes into the press release.
- Sectors compared: Situation, expectations, orders and investment per sector as a heatmap: where the mood turns, it shows immediately.
- Risk ranking: The multiple-choice question on the biggest business risks as bars, compared across waves: which risk is rising, which is falling.
Go deeper
Related survey templates
- Brand Tracker (wave survey)The full brand funnel with named Waves, case counts and automatic previous-Wave comparisons: awareness, consideration, usage, advocacy and image profile.
- Conjoint Analysis: Product PreferencesUse a Choice-Based Conjoint analysis to learn which features and which price really drive purchase decisions – respondents repeatedly choose their preferred offer from realistic product combinations.
- Shopper Style Analysis (Consumer Styles Inventory)Eight scientifically described shopping styles from quality-conscious to impulsive – as a personal profile with your two strongest styles.
- Gabor-Granger Price TestThe classic pricing method: purchase intent at several price points yields a demand curve and the revenue-optimal price.
Frequently asked questions
How do we compute the balance and the climate index?
How do we keep the time series comparable over years?
Can members see their own sector in comparison?
Start with this template
Load the template into DataLion, adapt it to your brand and start collecting responses — GDPR-compliant, in minutes.