The Codebook - Part 1
What is a codebook and why do I need one?
The codebook contains all the key instructions and criteria used to link your data with DataLion. It defines the default settings of a project and, more broadly, serves as a set of working instructions.
Examples of default settings:
-
Navigation structure (multiple variables can be bundled together, for example, to improve clarity)
-
Combining variables into a single chart
-
Variables and the values of their categories
-
Labels (e.g. question text and categories)
-
Default chart types
The codebook lets you visualize data quickly and easily. The default settings can be changed flexibly at any time via the administration area of the dashboard.
Structure of the codebook
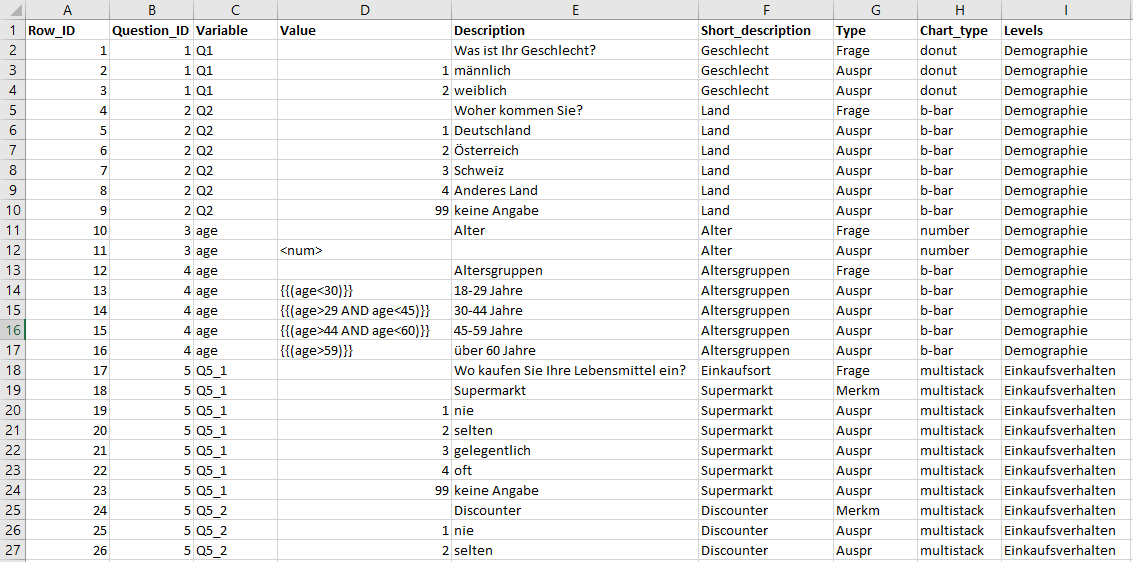
The following columns should be created:
Row_ID
The row ID is numbered consecutively. A row ID may not be assigned more than once. DataLion refers to the row ID when creating the charts. If you change the row ID in the codebook, you also need to adjust the drop-down filters, for example.
Question_ID
The question ID is also numbered consecutively. Rows that have the same question ID are combined in the dashboard. This bundles multiple variables and categories into a single chart and displays them, for example, as a stacked column chart.
IMPORTANT: Row ID and question ID may not be assigned more than once.
Variable
Variables denote specific characteristics or subgroups (possibly within a question). Under Variable, you define which variable (column) in the dataset the respective row refers to. A variable can comprise several categories.
Value
The categories are specified via the Value. Using the Variable and Label columns, the data can finally be linked in DataLion.
For non-numeric variables, i.e. when the categories are to be displayed as text, there are two ways to handle this in the codebook:
-
Each category is created with its associated value (Value; the value stored in the data) and the desired label (Label). DataLion reads the specified values from the data and processes them accordingly.
-
Categories are to be read directly from the data. In this case, the value

In addition, the Value in the codebook can be used to create new variables, i.e. to recode or calculate them, by using the SQL command language to apply existing variables in the dataset for new categories or calculations. This can be used, for example, to form age groups or calculate scores.
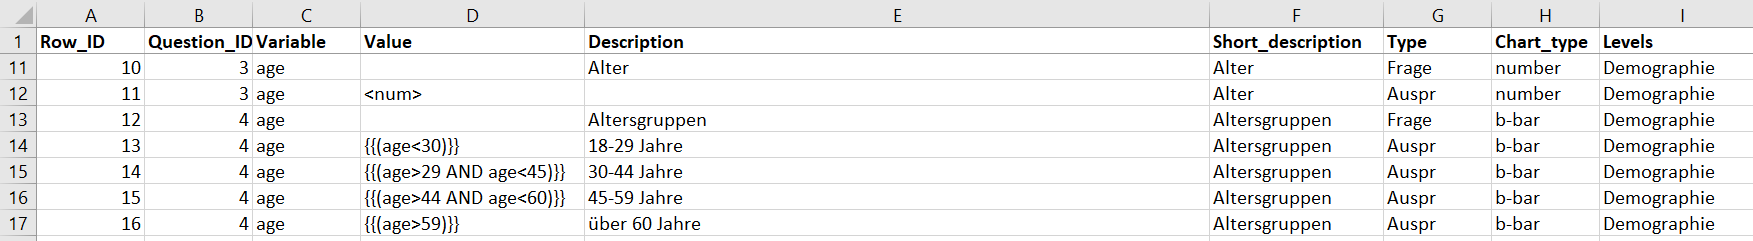
You can find a collection of SQL commands here.
Description
This column is used to label the categories and the question text in the chart in DataLion. The maximum length of the question is limited to 255 characters.
Short description
This column gives the chart a title and appears in the navigation.
Type
The type indicates whether it is a question, characteristic, or category. This means that every category also requires a question. Simple questions comprise a question and categories. Stacked questions contain all three types, i.e. question, characteristics, and categories.
Chart type
The chart type defines the chart in which the data is to be displayed. If you already know in advance how the results should be visualized (e.g. as a column or pie chart), you can select the corresponding chart type here. However, the chart type can also always be changed afterwards via the administrator area. Here you can find an overview of the available chart types along with tips on which chart type is suitable for particular data.
Level
The level defines the navigation structure. It is also possible to create several levels.
Special columns that can optionally be created:
In addition, you have the option to create special columns in the codebook, which can optionally be added.
The “Numeric” column (order) For example, you can also define the order of the categories in the codebook. If the order is not defined, DataLion arranges the categories one after another according to the row ID. The sorting is defined by the “numeric” column.
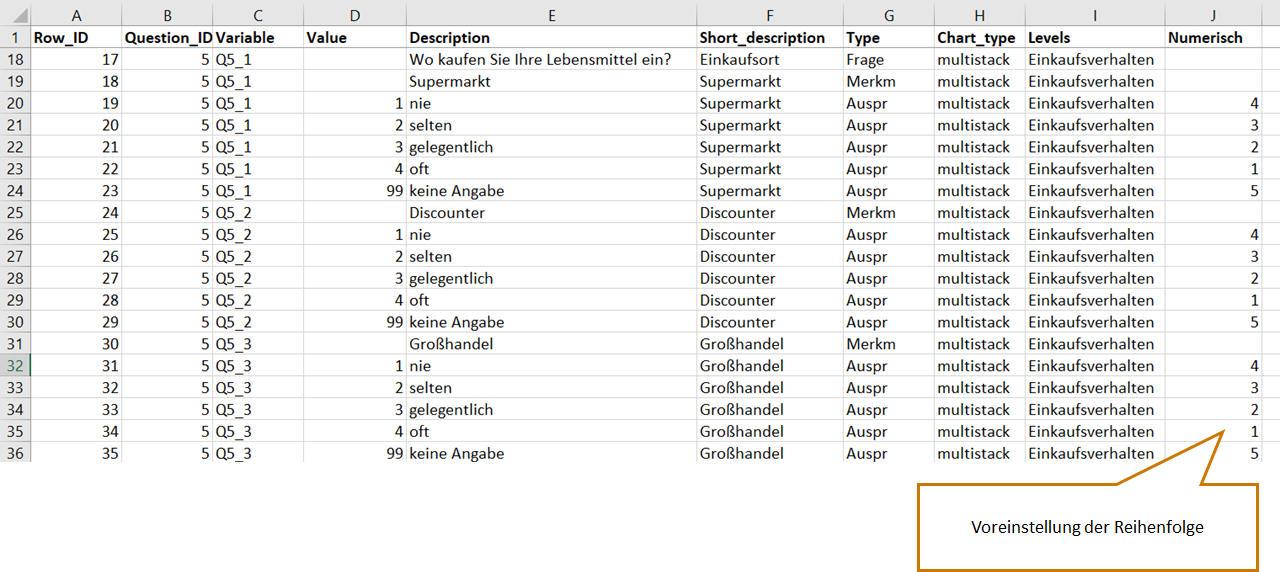
- The “Numeric” column arranges the categories consecutively according to the specified numbering (1, 2, 3, …)
The “Sorting order” column
You can also change the sorting order in the chart settings (e.g. ascending or descending). If a category should always be placed at the end of the sorting (e.g. “Other”), this is made possible by an additional column.
- Using the value “1” in the “Sorting order” column, a category is not sorted, i.e. always positioned last; the value “0” is used for all other categories, which remain sortable
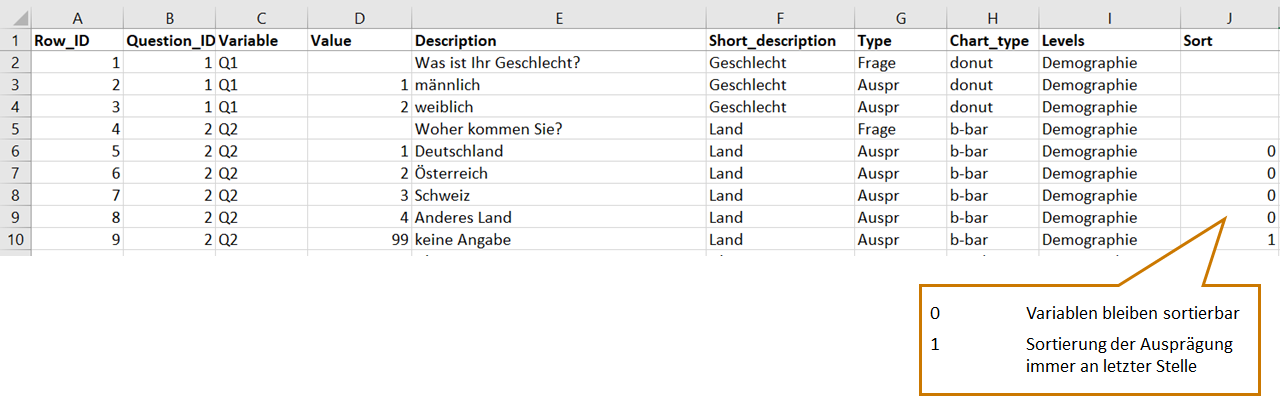
IMPORTANT: When uploading the codebook, the column must be linked to the “Variable Display” column.
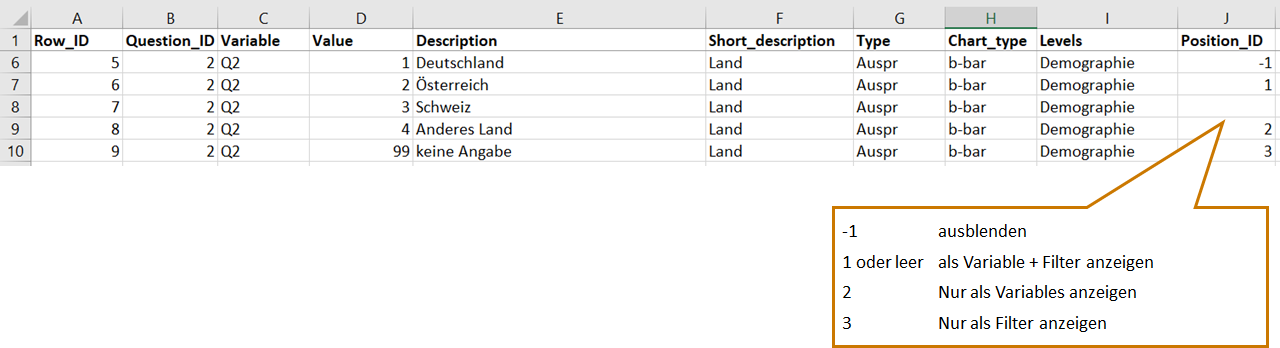
The “Position_id” column
In the codebook, you can also define the navigation menu via the “position_id” column, i.e. which variables are shown and hidden.
IMPORTANT: When uploading the codebook, the new columns must be linked to the “Variable Display” column.
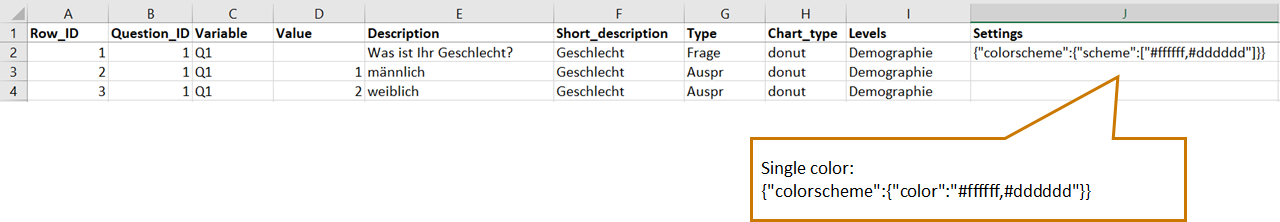
The “Settings” column (color scheme)
In the codebook, you can also configure an individual color scheme per question/measure.
e.g.: {“colorscheme”:{“scheme”:[“#ffffff,#dddddd”]}}
IMPORTANT: When uploading the codebook, the new columns must be linked to the “Settings” column.
Tip: DataLion can only visualize columns that have also been linked. This should be kept in mind in particular when variables are renamed.
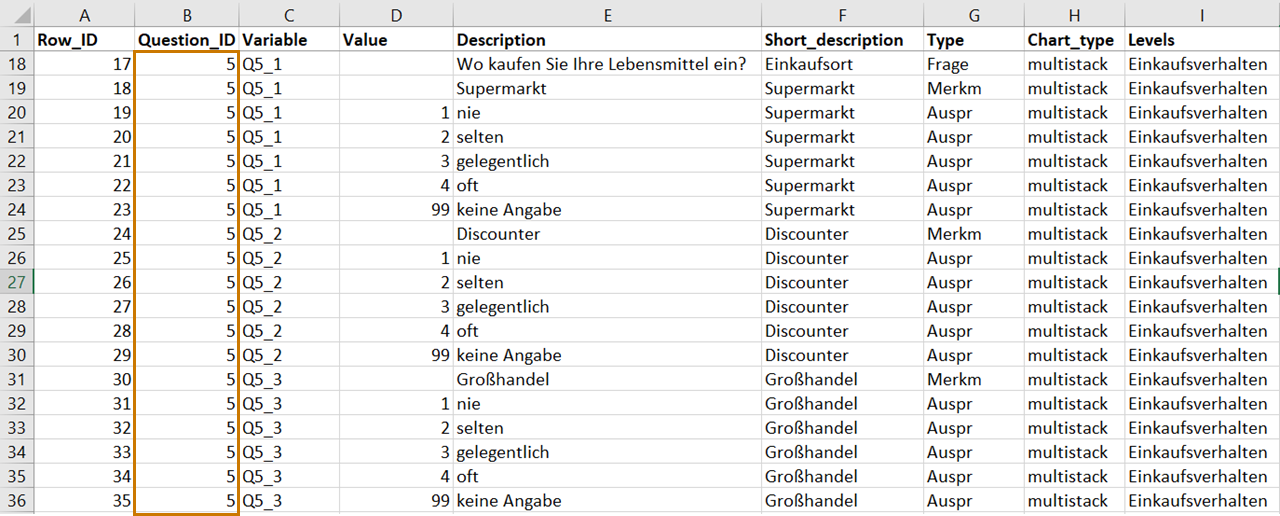
How can multiple responses be displayed in a single chart?
In the codebook, you can bundle multiple responses into a single chart. This works via the Question_ID column. Variables that contain the same question ID are bundled into a single chart.
Example:
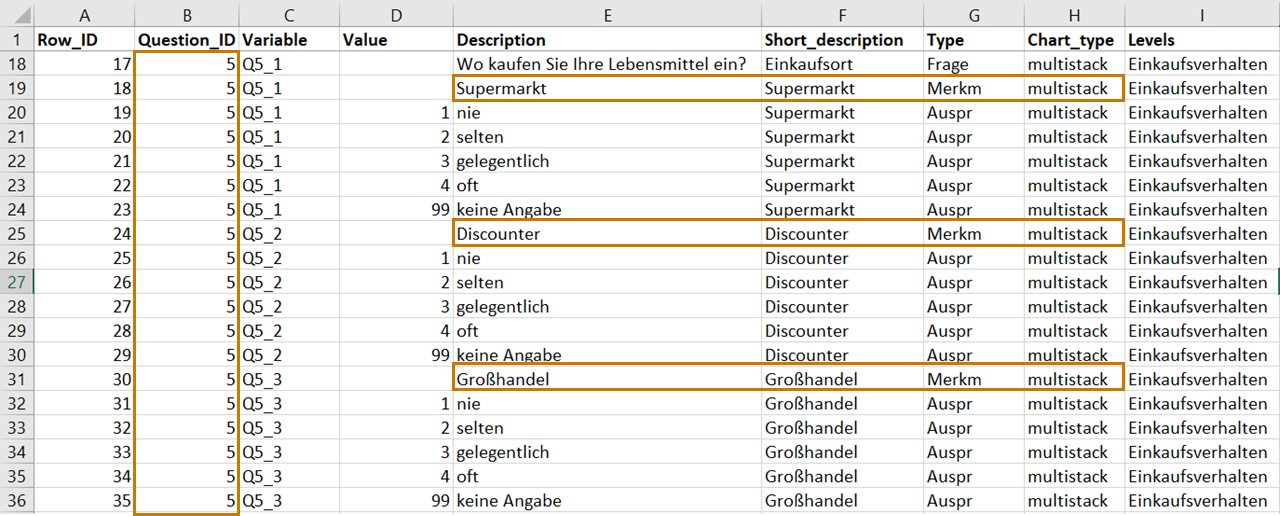
How can stacked column charts be displayed in a single chart?
In the codebook, you can also display several stacked column charts in a single chart. To do this, the chart type “multistack” is used and each characteristic is created one after another. Assignment to a chart works via the Question_ID column. Characteristics that contain the same question ID are bundled into a single chart.
Example:
Codebook import
The codebook can be imported in the project backend > Codebook via the Upload Codebook field.
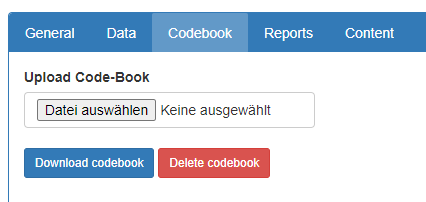
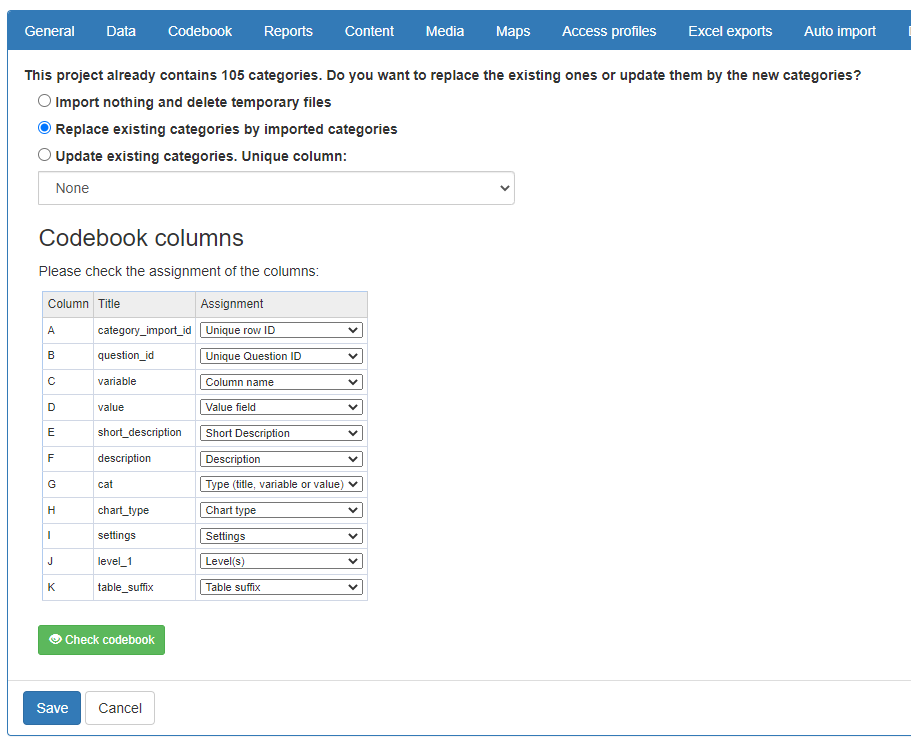
After you have selected your codebook file and clicked save, the preview shown below appears. Select Replace existing categories by imported categories and assign the columns of your codebook (Title) to their respective function (Assignment).
By clicking Check Codebook, DataLion checks the codebook for formal errors, such as
-
duplicate row IDs
-
multiple rows or no rows with Type = Question within a question ID
-
use of variables that do not exist in the dataset
-
different levels within a question ID
Continue here with Part 2. In that section, we show you how to perform calculations and recodings.