
User Experience Questionnaire (UEQ-S)
The short version of the established UEQ: 8 semantic differentials measure pragmatic and hedonic quality – free to use, with an international benchmark.
The live demo opens the real questionnaire — no signup required.
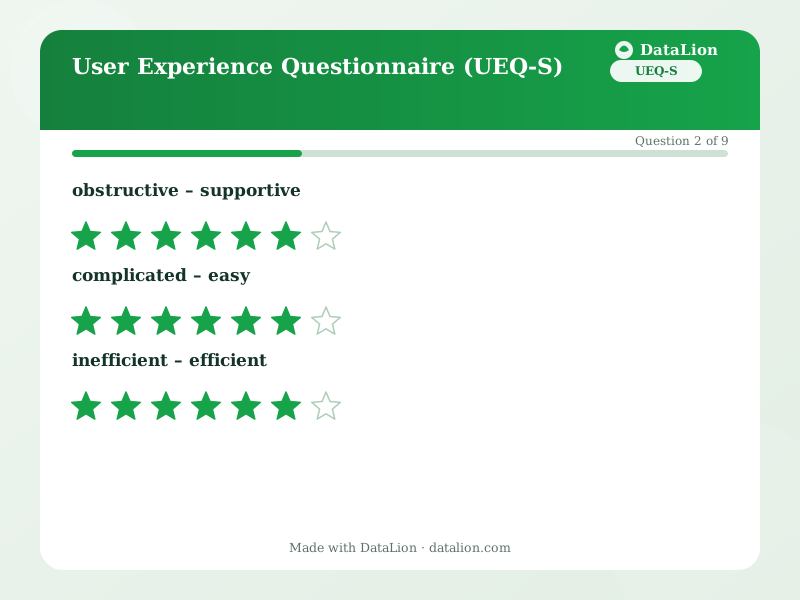
The User Experience Questionnaire (UEQ) by Laugwitz, Held and Schrepp is one of the most widely used UX instruments – and is explicitly free to use commercially. This template uses the validated short version UEQ-S: 8 contrasting pairs as seven-point scales that condense into two dimensions. Pragmatic quality (obstructive–supportive, complicated–easy, inefficient–efficient, confusing–clear) describes whether the product works; hedonic quality (boring–exciting, not interesting–interesting, conventional–inventive, usual–leading edge) describes whether it delights. Where the SUS measures usability alone, the UEQ-S also shows whether your product sparks joy.
When should you use this template?
This template is a great fit for:
- As a short UX measurement after product tests, in-app or post-onboarding
- When delight (hedonic quality) matters alongside usability
- For before/after comparisons in redesigns
Every question in this template
- 1Rating
obstructive – supportive *
How do you experience the product?
- 2Rating
complicated – easy *
- 3Rating
inefficient – efficient *
- 4Rating
confusing – clear *
- 5Rating
boring – exciting *
- 6Rating
not interesting – interesting *
- 7Rating
conventional – inventive *
- 8Rating
usual – leading edge *
- 9Long text
What is the most important reason for your rating?
From questionnaire to dashboard
Each contrasting pair becomes its own variable – the dashboard condenses them into the two UEQ dimensions:
- Pragmatic vs. hedonic quality: The means of item groups 1–4 and 5–8 as side-by-side bars: does your product merely work – or does it also delight?
- Item profile of all 8 pairs: The classic UEQ profile: means per pair reveal whether e.g. “complicated” or “boring” is the real problem.
- Development across releases: Both dimensions as lines across survey waves – so you see whether a redesign genuinely improved the experience.
- Spread per dimension: Box plots show how much your users agree – a wide spread points to very different user groups.
- AI topic analysis of reasons: The open question delivers the why behind the numbers – clustered with DataLion's AI topic analysis.
Go deeper
Related survey templates
- Restaurant Guest FeedbackShort, anonymous feedback on food, service and ambience – via QR code on the table, the bill or the menu.
- System Usability Scale (SUS)The standard usability questionnaire: 10 statements, one score from 0 to 100 – comparable with thousands of studies. Includes the established German translation.
- Beta Test FeedbackStructured feedback from beta testers: usage depth, stability, missing features and the disappointment question as an early product-market-fit indicator.
- Campsite Guest Survey (post-stay)After departure, collect feedback on pitches, sanitary facilities, team and activities – via QR code at reception, at the barrier or in your departure email.
Frequently asked questions
UEQ-S or the long version?
How are the values interpreted?
Is the UEQ really free to use?
Start with this template
Load the template into DataLion, adapt it to your brand and start collecting responses — GDPR-compliant, in minutes.