
Win-Loss Analysis
Systematic survey after won and lost deals: decision drivers, competitive comparison and what would have tipped the scales.
The live demo opens the real questionnaire — no signup required.
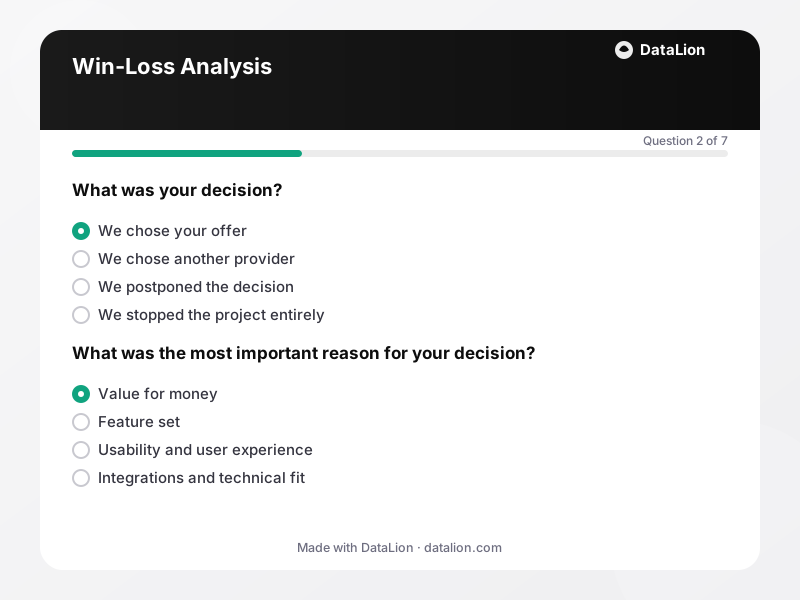
The most honest answers about your offer come from people who just made a buying decision – in either direction. A systematic win-loss analysis asks structured questions after every decided deal: what was the most important decision driver? How did price, features, integrations and trust compare in importance? How did our team perform during the process – and what would have flipped the decision? The key is the combined analysis: only comparing won against lost deals reveals which factors actually decide outcomes. Send the survey soon after the decision and ideally from a neutral sender, not the account executive.
When should you use this template?
This template is a great fit for:
- As a standard after every decided B2B deal (won and lost)
- Analysed quarterly as an early-warning system for competitive shifts
- Before pricing or product decisions as a fact base instead of sales anecdotes
Every question in this template
- 1Single choice
What was your decision? *
- We chose your offer
- We chose another provider
- We postponed the decision
- We stopped the project entirely
- 2Single choice
What was the most important reason for your decision? *
- Value for money
- Feature set
- Usability and user experience
- Integrations and technical fit
- Security, data protection and compliance
- Trust in the vendor and support
- 3Ranking
How important were the following factors for your decision overall?
Please rank the factors – the most important first.
- 1Price
- 2Functionality
- 3Ease of use
- 4Integrations
- 5Security and compliance
- 6Trust in the vendor
- 4Matrix
How did you experience our sales process?
Very poor Poor Average Good Very good Product demo and presentation Responsiveness Understanding of our requirements Pricing transparency Quality of the written proposal - 5Short text
If you chose another provider: which one?
- 6Rating
How likely would you be to consider us again for a future decision?
- 7Long text
What would most likely have changed your decision?
From questionnaire to dashboard
The dashboard thrives on comparison: every analysis can be split by “won” versus “lost”:
- Win rate: The share of won decisions as a KPI tile, filterable by segment, deal size or quarter.
- Decision drivers: won vs. lost: The top decision driver as clustered bars per outcome – the one chart that shows why you actually win and lose.
- Factor ranking: The ranking of decision factors shows what buyers really weigh – often differently than sales assumes.
- Process rating: Means for demo, responsiveness, requirements understanding and proposal quality – your coaching map for the sales team.
- The tipping point: The open question on what would have flipped the decision, clustered via AI topic analysis – producing roadmap arguments in the customer's own voice.
Related survey templates
- Restaurant Guest FeedbackShort, anonymous feedback on food, service and ambience – via QR code on the table, the bill or the menu.
- System Usability Scale (SUS)The standard usability questionnaire: 10 statements, one score from 0 to 100 – comparable with thousands of studies. Includes the established German translation.
- Beta Test FeedbackStructured feedback from beta testers: usage depth, stability, missing features and the disappointment question as an early product-market-fit indicator.
- Campsite Guest Survey (post-stay)After departure, collect feedback on pitches, sanitary facilities, team and activities – via QR code at reception, at the barrier or in your departure email.
Frequently asked questions
When and by whom should the survey be sent?
Do lost prospects even respond?
How does the survey complement qualitative win-loss interviews?
Start with this template
Load the template into DataLion, adapt it to your brand and start collecting responses — GDPR-compliant, in minutes.