
🚀 Highlights
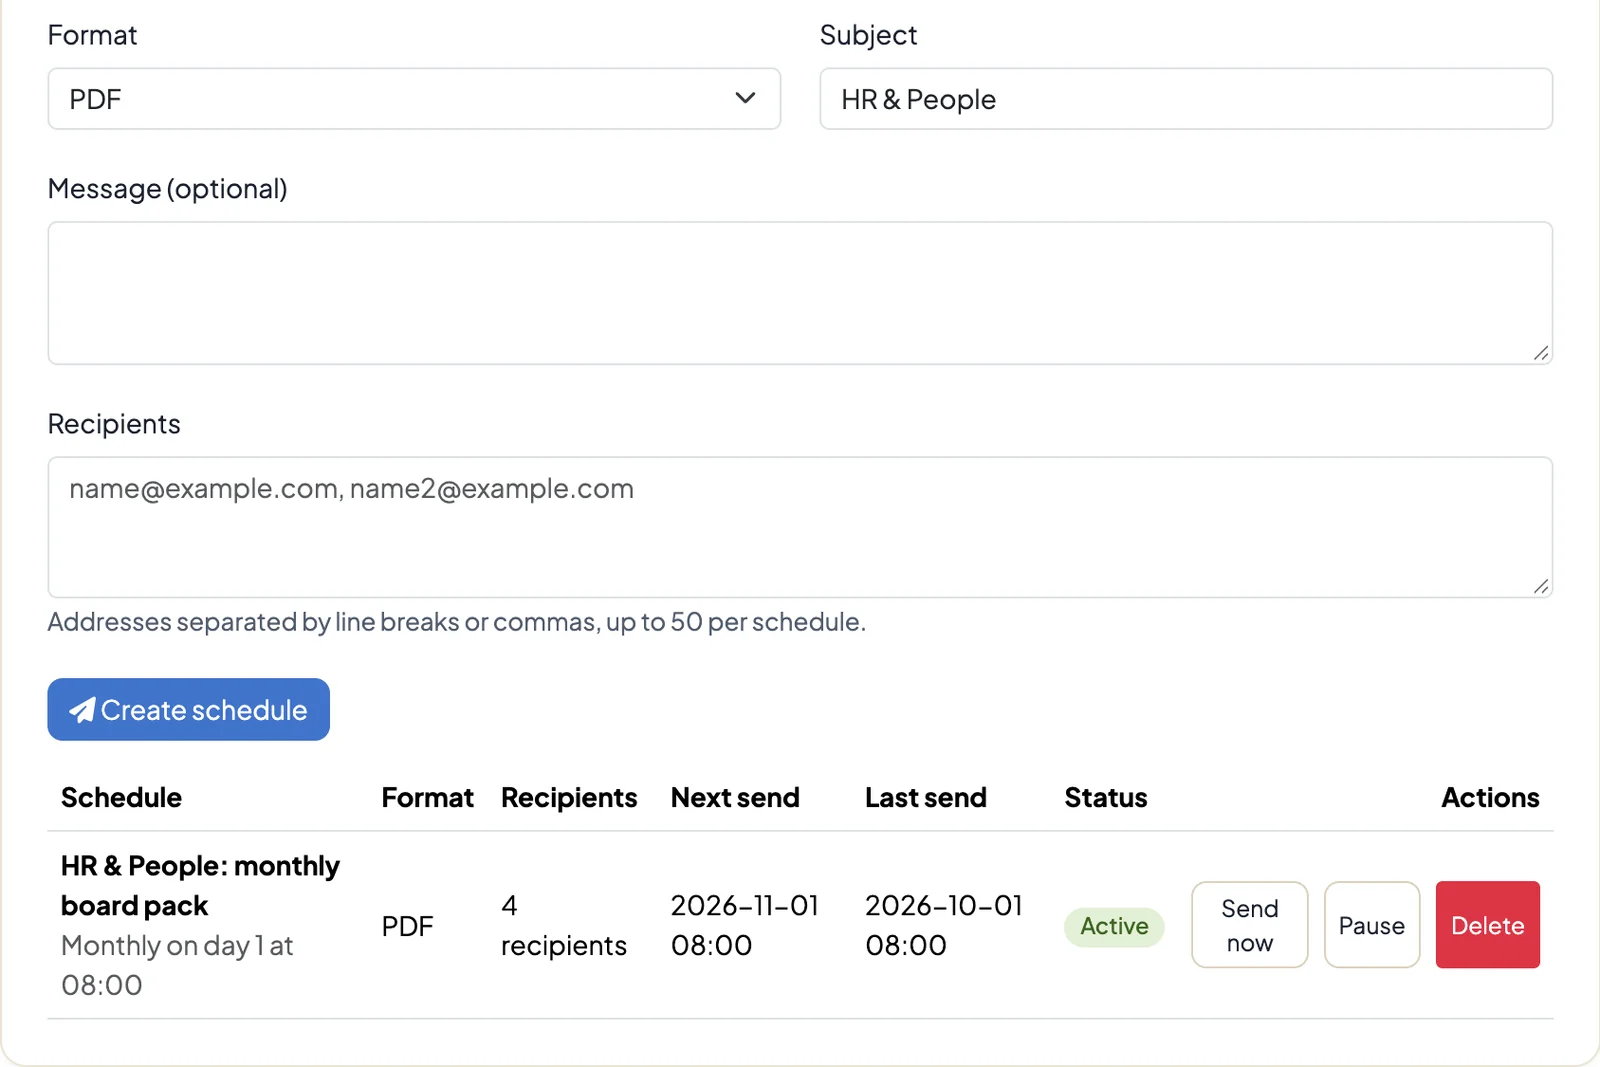
Reports go out on a schedule: The report editor has a new Delivery section. Set a whole report to go out daily, weekly or monthly as a PDF or PowerPoint file, on the hour you choose. Enter the subject, a short message and the recipient list once. When the time comes, DataLion builds a fresh file and sends each person their own email. Replies come back to you, because you are the reply address, and recipients can unsubscribe from a link in the email without a DataLion account.
The list of schedules shows the next and last send, the number of recipients and any delivery error. You can pause a schedule, resume it or trigger it right away with Send now. By default a schedule takes up to 50 recipients. If a file grows beyond 15 MB, recipients get a message asking them to request it from the sender instead of the attachment.
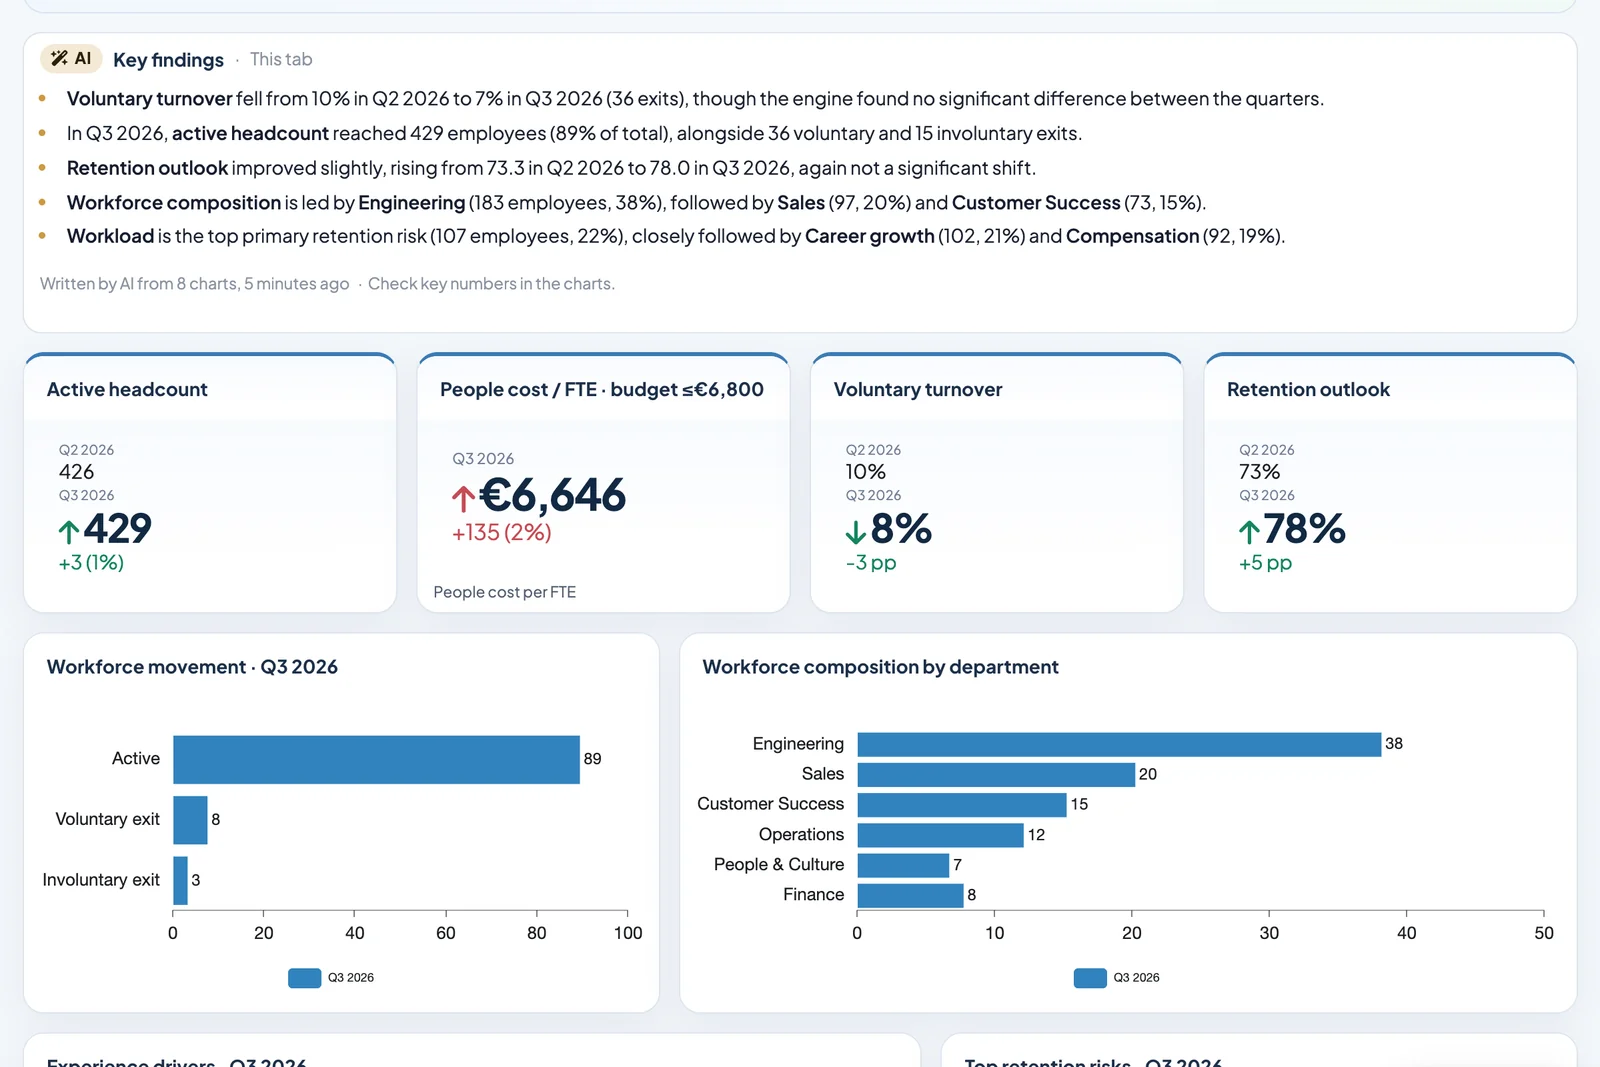
AI summary on the dashboard: Choose + New → New AI summary to put a card with the key findings on the tab. The AI reads up to 30 charts with their weighted results, bases, significance notes and the active filters. Under Instruction and scope you decide whether it summarises this tab, the whole report or the whole project, and you can give it your own instruction, such as "five bullet points for the leadership team".
When someone switches to a filter that has no summary yet, the old text stays visible and is marked as out of date until you choose Update summary. PDF, image, PowerPoint and Google Slides exports generate missing summaries for the exported filters on their own; Excel leaves text cards out. Each summary says how many charts it was written from and reminds readers to check key numbers in the charts. The card is available when built-in AI is switched on for your workspace.
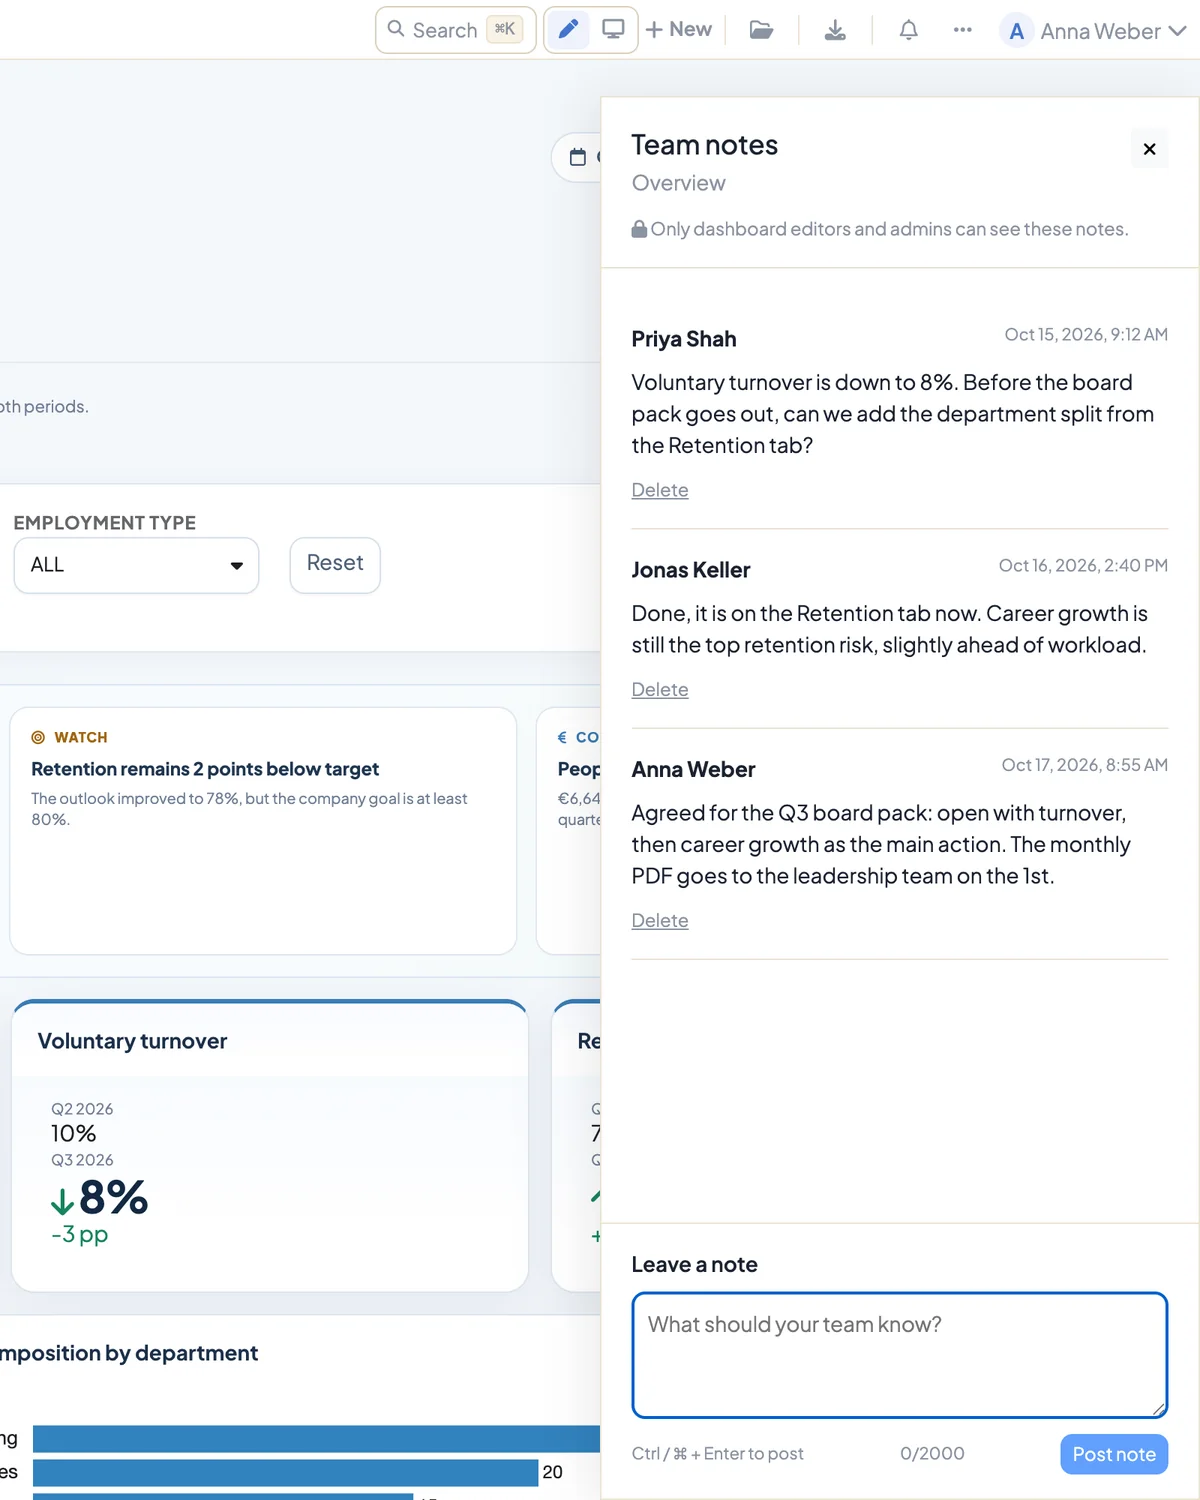
Team notes on the dashboard: Saved dashboards now have a Team notes sidebar. Editors use it for questions, decisions and handovers, each with a name and a timestamp. You can delete your own notes, and administrators can remove any note. Only the editing team sees them; they never appear in shared views, embeds or exports. Ctrl or ⌘ plus Enter posts a note.
Next to the search there is also a switch between Edit and View mode. View mode hides the editing tools and locks the grid, so you see the dashboard the way your readers do. The browser remembers your choice, and the command palette under ⌘/Ctrl+K offers the switch too.
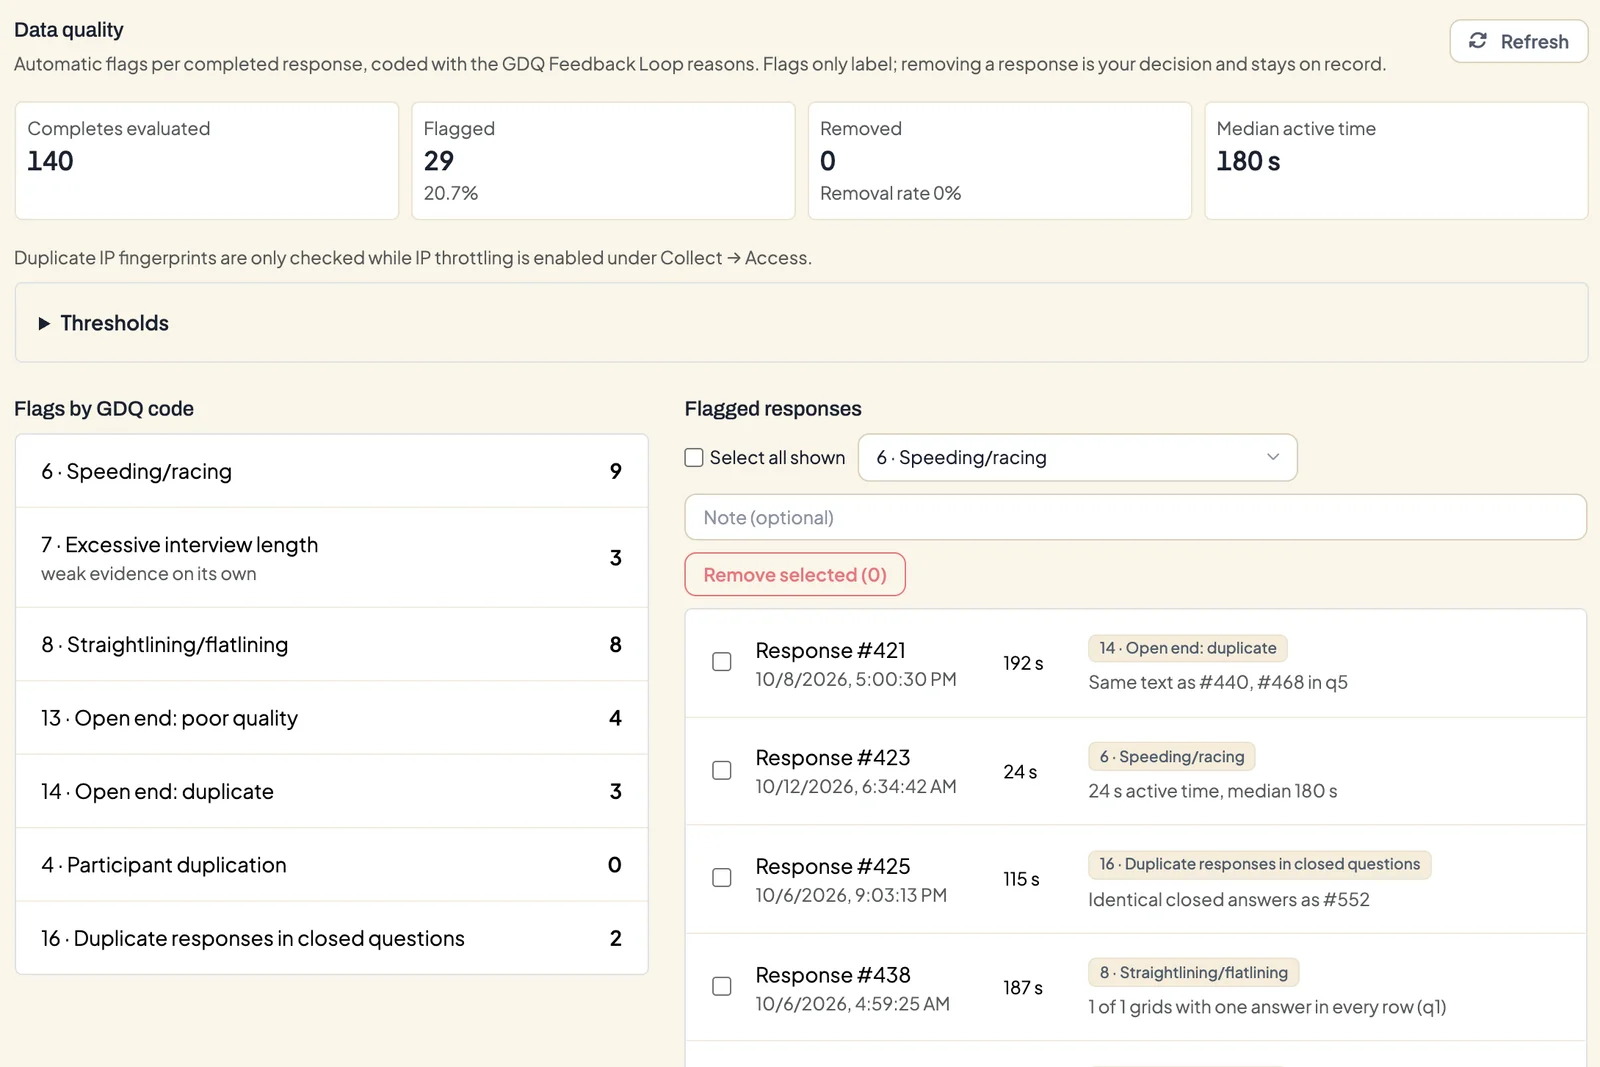
Check survey data quality and keep a record: The Monitor tab of a survey has a new Data quality section. DataLion flags completed interviews that stand out: speeders (under a third of the median active time) and very long interviews, straightlining in grid questions, gibberish or repeated open answers, identical answer patterns in closed questions and, with IP throttling switched on, repeat responses from the same connection. You can adjust the thresholds. Every flag carries a code from the GDQ Feedback Loop, the reason catalogue of the Global Data Quality initiative.
A flag never removes anything. You take responses out yourself, with a GDQ reason and an optional note, and you can restore them at any time. The survey record stays intact, and the log of every decision downloads as a CSV. For published surveys, Write flags to dataset adds the checks as variables to the data, so you can filter or cross-tabulate by them on the dashboard.
✨ What's New
🎨 Upload a PowerPoint master once: Admin → Theme Studio → PowerPoint masters holds a library for the whole workspace. Upload a .pptx with a chart placeholder, map its layouts under Configure and choose a default. In a project's export settings you pick that default, another master from the library or the DataLion standard. Existing project masters keep working and can move over with Move to library. Custom masters require the white-label feature. More on the PowerPoint export.
🔌 Connect Claude and ChatGPT by signing in: The pages Admin → AI → Claude and Admin → AI → ChatGPT show your instance's MCP address and the steps in each client. Supported clients, such as custom connectors in Claude, open a DataLion sign-in where an administrator picks the access level and approves the connection. Connected clients are listed on the same page and can be revoked there. After 90 days the client has to sign in again. API tokens and the Claude Desktop extension keep working. More on the MCP integration.
📈 Improvements
🧭 Project navigation by task: Project pages are grouped into Results, Data, Collect, Share and Settings. Settings stay visible, and Labels only appears in projects with matching questions. The codebook is more compact and shows bulk actions once you select rows.
🖌️ Modern dashboard style: Under Admin → System → Branding you choose between Classic, the default, and Modern. Modern brings rounded cards, filter chips, quieter axes and, if you want it, emphasis on the largest bar. Project and chart settings take precedence.
✍️ A new text editor: Text boxes get their own editor for formatted text, tables, images, links, formulas and source code, with drafts, undo and keyboard shortcuts. It is translated into all six interface languages.
📥 More control over imports: The upload preview puts the import decisions first. Before you append data, you review question labels that differ and decide per question whether to keep them separate or combine them with the existing or the incoming labels. Multiple-response detection understands suffixes such as
_99, SPSS metadata survives regenerating the codebook, and wide datasets import more reliably.⏹️ Cancel an import: Cancel import stops queued imports at once and running ones at the next checkpoint, until final publication starts. Rows a regular update has already written stay in place, and the dialog says so.
📤 Faster, more faithful exports: PDF exports wait for charts and fonts, PDF and image exports keep the current dashboard state, and Excel fetches charts in parallel. Reports keep the visible tab order, and bars and columns in PowerPoint start at zero.
📝 A more reliable survey builder: Saving, page changes, answer options and validation are steadier. The monitor names the page where people dropped out, and links to scoring results open the right tab.
📊 Measurement in our own system: DataLion no longer sends product analytics to PostHog and measures usage in its own system instead. The data processing agreement is now at version 2.2.
🔐 Security
Chart requests validate their input more strictly, minimum base rules for exports are enforced on the server as well, and actions that change something can no longer be triggered by a plain link. Browsers only run scripts that DataLion has approved.
🐛 Important Bug Fixes
- Charts: Grouped bars keep their series colours, long labels are no longer clipped, factor analyses show up again, and the base line names the weighting.
- Filters: Filter menus open below their chip, searches with special characters work, and anonymous visitors no longer see saved user filters.
- Exports: Reports no longer lose tabs when the live chart list differs from the saved page. Imported projects open on a tab with content.
- Data: A replacing upload keeps columns that a codebook script combines, and URL imports detect the source's delimiter.
- Billing: Billing forms forward to checkout again and collect the details needed for VAT.
Enjoy DataLion 2026.2.199. When you send your first scheduled report, we would love to hear how it went.