
Work faster with the command palette (⌘K)
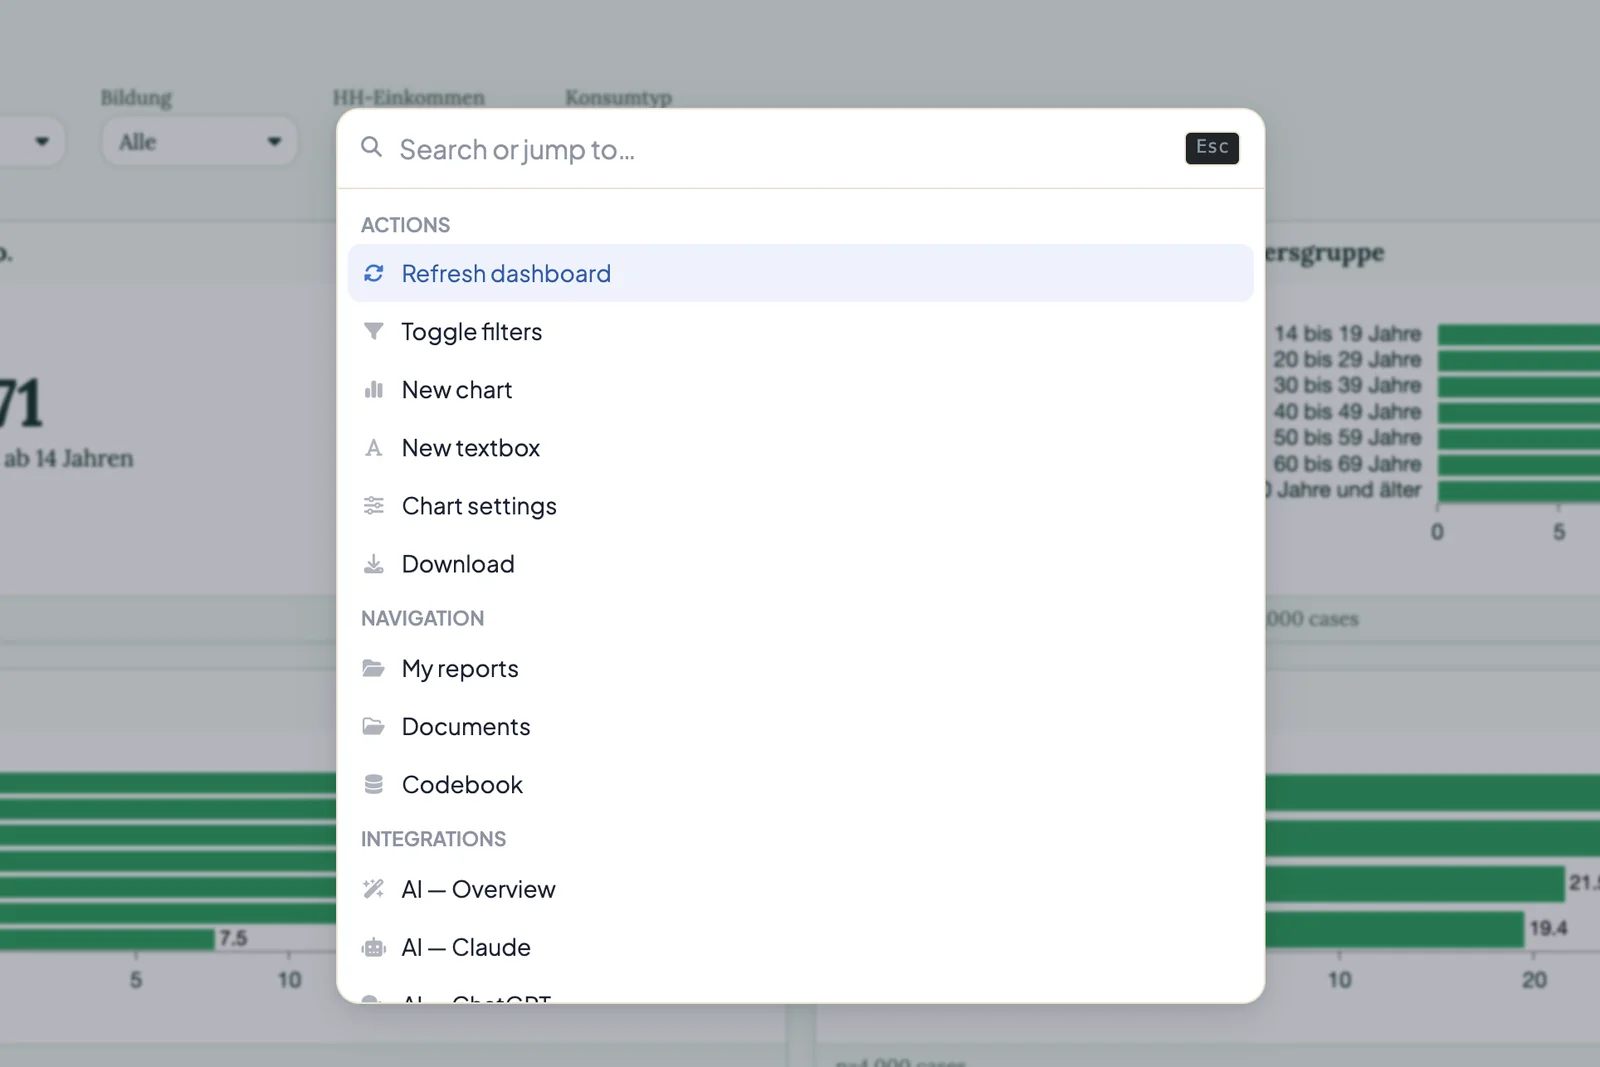
The command palette saves clicks. A keyboard shortcut opens a search field where you find the current project’s questions and reports and run common actions directly, such as adding a new chart or refreshing the dashboard. The admin area has its own palette for settings pages and projects.
Requirements
- DataLion release 2026.2.192 or later.
- An open project.
Open the palette
Press ⌘K on a Mac or Ctrl+K on Windows and Linux. You can also click Search in the top bar. Esc closes the palette.
Search and jump
Start typing as soon as the palette is open. The list narrows with every letter:
- Questions in the current project, matched by question text, variable name or ID. The variable name appears on the right. Selecting a question opens it as a chart.
- Reports you’re allowed to open, matched by name
The palette shows up to eight questions and six reports. Use the arrow keys to pick an entry and Enter to open it. Questions hidden by your access profile don’t appear.
Actions
With no search term, the palette lists the available actions:
- Actions: Refresh dashboard and Toggle filters, which shows or hides the filter row. If you can edit the project, you also get New chart, New textbox and Chart settings. With export rights, Download is added.
- Navigation: My reports and, if enabled, Documents. Administrators can also jump to the Codebook and, under Integrations, to the AI pages such as AI — Overview or AI — Claude.
In the admin area
In the admin area, ⌘K or Ctrl+K also opens a search, here through the Search field in the top right. It finds settings pages such as Users or Theme Studio and your projects. That gets you to a specific project’s settings without going through the sidebar.
Tips
- If you know a question’s variable name, type it directly. It’s found just like the question text.
- From the keyboard, a new chart is quickest: ⌘K, “New chart”, Enter.
- To adjust the new chart, see Edit chart data and Available chart types.