
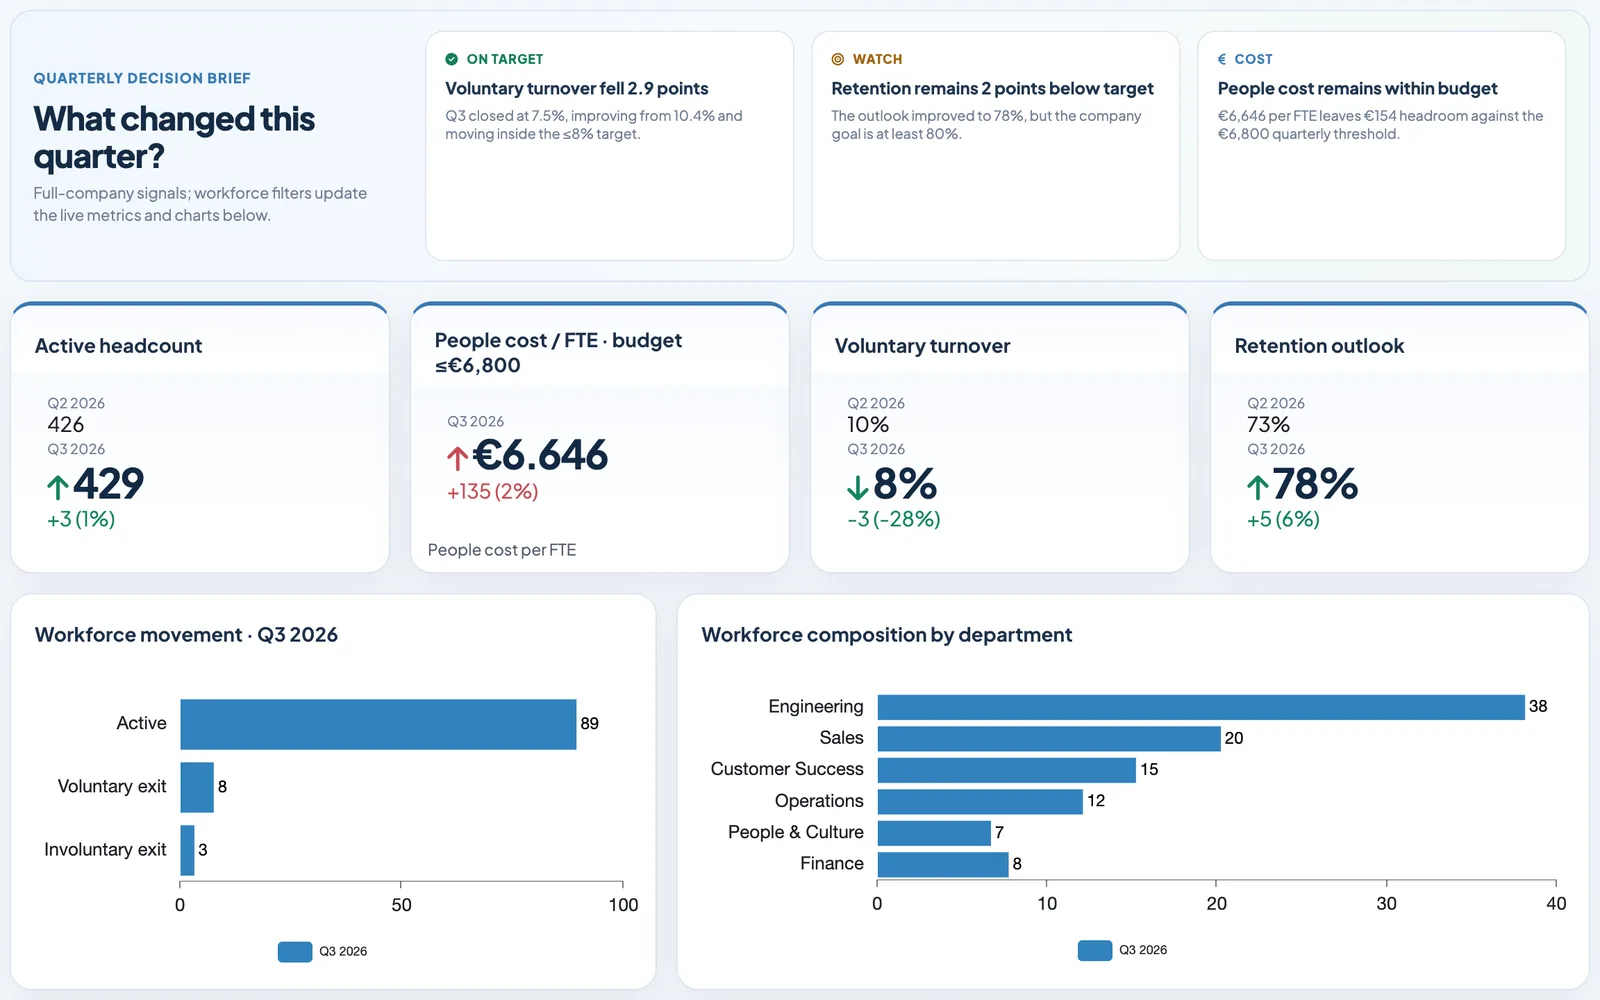
In short: most HR dashboards show whatever the HR system outputs anyway: headcount, attrition, absence. Those are outcome measures: they report what has happened and leave open why. The metrics that actually trigger action come predominantly from surveys, and therefore follow rules of their own that HR dashboards regularly fail.
Outcome measures and leading indicators
It pays to sort HR metrics into two classes before building a dashboard.
Outcome measures report what has happened: attrition rate, absence rate, time-to-hire, cost per hire. They are readily available because the HR system keeps them anyway, and they are indispensable for planning and statutory reporting. For steering they are of limited use: by the time attrition rises, the cause is months old and the people concerned are gone.
Leading indicators show what is building up: intention to stay, satisfaction with one's manager, perceived workload, psychological safety in the team, willingness to recommend. These numbers arise almost exclusively from surveys, and that is precisely why they are missing from many HR dashboards, even though they are the only ones where acting still changes something.
A usable HR dashboard contains both and puts them side by side. Only then can you answer the question that counts: is attrition rising where intention to stay dropped two quarters ago?
Metrics that trigger a decision
Retention and attrition
- Attrition rate – but split into voluntary and involuntary, otherwise it mixes two phenomena
- Early attrition (leavers within the first twelve months) – measures recruiting and onboarding, not the organisation
- Intention to stay from the survey – the leading indicator for the attrition rate
- eNPS with a time series and a breakdown by unit
Workload and health
- Absence rate – as a rate and split into short-term and long-term, because the two have different causes
- Perceived workload from the survey
- Results of the psychological risk assessment – a statutory requirement in Germany, and rarely evaluated
- Untaken leave balances – an underrated leading indicator of overload
Recruiting
- Time-to-hire and time-to-fill – not the same thing, and the gap between them is the interesting number
- Offer acceptance rate
- Application drop-off rate – usually a process problem, not a market problem
- Candidate satisfaction from a short survey after the process
Development
- Training participation by unit – large differences are a leadership topic
- Internal fill rate for open positions
- Self-assessed skill gaps from the needs assessment
The three rules HR dashboards fail on
1. Anonymity has a minimum group size
This is the point that distinguishes HR dashboards from all others, and the most expensive mistake when it is overlooked.
As soon as survey data is filterable in the dashboard, the possibility of re-identification arises. A breakdown by department, site and age group can, in combination, shrink to three people, and anyone on the team who knows who is over 50 can attribute the answer. The promise of anonymity is broken at that point, regardless of whether anybody actually does it.
The consequence is a hard floor: only display results above a minimum number of cases, usually five to ten, and for every filter combination rather than just the overall view. That is not a fine-tuning setting, it is the precondition for the next survey getting honest answers at all.
2. Survey data needs significance
eNPS rises from 12 to 17. Is that the measures working, or noise? With 80 respondents in that unit it is almost certainly noise, but it gets read as an upward trend in the dashboard and used to justify decisions. A significance test that recalculates as you filter is therefore not a luxury; it stops chance from turning into programmes.
3. Outcome measures and survey data live in different systems
Attrition and absence come from the HR system, intention to stay and workload from the survey. They only sit side by side once somebody brings them together, and that is usually where it fails, because the two species of data work differently. Survey data carries weights, value labels and waves that a classic HR system does not know and a BI tool ignores. More on this: why survey data breaks your BI stack.
How to start
- Pick three outcome measures you report anyway: attrition, absence, time-to-hire. They are in the HR system and available immediately.
- Add one leading indicator. A short pulse survey covering intention to stay and workload is enough to begin with and delivers half the insight.
- Set the minimum group size before the first dashboard is shared. Having that discussion with the works council afterwards is considerably less pleasant.
- Answer one question completely instead of introducing all metrics at once. For example: in which units do high attrition and low intention to stay coincide?
The general questions about setting one up (choosing metrics, connecting data, refreshing) are covered on our KPI dashboard page.
Co-determination
An HR dashboard that analyses employee data touches co-determination law in Germany: technical systems capable of monitoring behaviour or performance fall under section 87(1) no. 6 of the Works Constitution Act (BetrVG), and "capable" is enough, no intent is required. Similar works council or employee representation rules apply across much of the EU. Involve the works council before rollout, not after the first report. That is also the best way to fix the minimum group size in writing. This is general orientation and does not replace legal advice.
Finally, on our own behalf
In DataLion both species of data sit side by side: outcome measures from Excel and CSV or via a database connection, survey data from SPSS including labels and weighting or straight from a pulse survey. Roles and permissions control who sees which breakdown.
Ready-made questionnaires for the leading indicators are available as templates: employee satisfaction, pulse survey, eNPS and psychological risk assessment.
Outcome measures and survey data in one dashboard: DataLion keeps minimum group sizes, weighting and significance intact while you filter, GDPR-compliant and hosted in Germany. See HR dashboards or try DataLion for free.