
The most important advanced settings and design options
1. Other frequently used data settings (backend)
In market research, data often has to be weighted and displayed over time.
If you want these factors to be taken into account, proceed as follows:
Navigate to the project backend.
Weighting
-
Under the “Settings” tab, select the “Weights” section.
-
Enter the variable name of your weighting variable under “Weights”.
-
By default, weighted case numbers are displayed as soon as a weight has been defined (if required, the setting can be changed in the “Data source and case numbers” section or in the chart itself).
Date/time variables
-
Under the “Settings” tab, select the “Date and time settings” section.
-
If you have a variable that is available in date format, you can select it from the dropdown under “Column with timestamp” and configure further settings for the display you want.
-
If you have a variable that is not available in date format but is to be used as a date/time variable (e.g. measurement points, quarters, months, etc.), enter the variable name under “Non-timestamp variable to be used as a timestamp” (either using the variable name or the ID_Unique from the codebook; see point 8). Several time variables can be entered separated by commas.
2. Dropdown filters (frontend – report settings)
There is an option to create individual filters on every dashboard (tab) to filter the data by certain characteristics or to display it split (dynamically, in contrast to the static filters described above). As a rule, these affect all charts of a dashboard (exceptions can be configured in the chart settings).
There are two types of filters:
-
“Normal” filters: if a category is selected here, only the data to which this category applies is displayed (e.g. if you select the 18-35 age group, all charts are displayed with the data of this age group only).
If several groups are selected (e.g. 18-35 and 36-45 years), the data of both groups is displayed together (here: 18-45 year olds) -
Benchmark filters: if categories are selected here, they are inserted into the charts as a split (e.g. if you select the age groups 15-35 and 60+, the values of both groups are displayed separately in the charts, which makes comparisons possible).
Creating filters
-
Navigate to the report in which you want to insert filters (folder icon at the top right).
-
Switch to the report settings: click the gear icon to the left of the tabs.
-
Under “Tabs” you will find the individual dashboards (note the names).
-
Under “Drop-down filter menu” you can create individual filters.
-
Click “Add filter”.

-
Filter variable: select the variable that is to serve as the filter
-
Name: the caption as it will later be shown in the dashboard.
-
Benchmark: click to activate → the selected options are displayed separately in a chart.
-
Multiple selection: several options may be selected at the same time.
-
Default value: the defined value is preselected as the default in the dashboard.
-
Scope: here the filter can be applied to the individual dashboard (tab) or to the entire report (settings are carried over between the tabs).
-
More specific settings can be made via the JSON code (you can find more information here).
3. The codebook (backend)
The codebook is a metafile in which information about your data set is stored, such as the answer categories that exist, value labels, variable captions, default display options of questions for the dashboards, etc.
It is generated automatically by default with the first data upload and can be used, for example, to adjust captions, to add newly added or missing answer categories, to create new variables and to recode existing variables. The codebook can be used both online and as an Excel download. For individual small changes we recommend using the online interface; for several and/or larger adjustments, the Excel download option.
You can find more detailed information here and here (codebook part 1 & 2).
Structure (Excel)
By default, the codebook initially contains the following information (you will also find it in the fields online):

-
ID_unique: This is a unique ID for every codebook entry, which must not occur twice (how to check in Excel: select the id_unique columns → Conditional Formatting → Highlight Cells Rules → Duplicate Values).
-
Question_ID: Entries with the same question_id are combined into one question.
-
Variable: This is the variable name as it was assigned in the data set.
-
Value: As a rule, these are initially the values that occur for a variable in the uploaded data set (the values of the answer categories).
Advanced: variables can also be recoded via this column; in this case you will find SQL formulas here. -
Entry_type: This column defines whether an entry is a question, an item or an answer category.
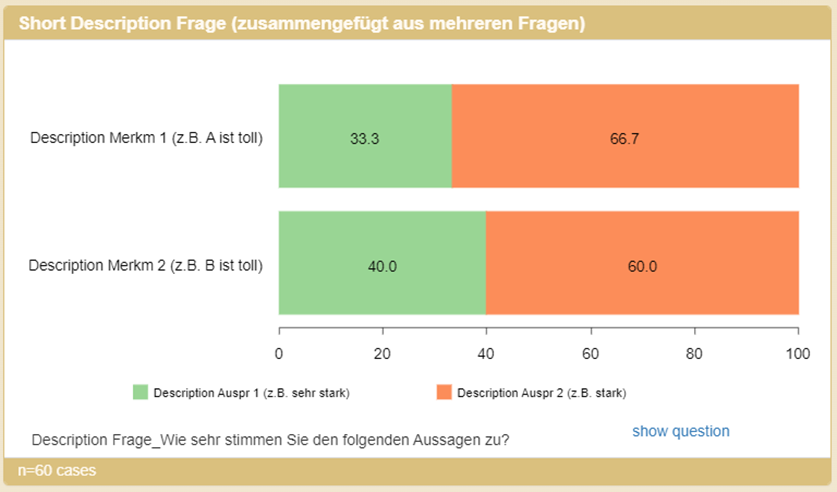
As a rule, at the beginning you will only find questions (Frage) with answer categories (Auspr). When combined questions are created (e.g. a question battery with agreement scales for different statements), the original questions become items (Merkm), which are then displayed as categories in a stacked bar chart. -
Label and Short_label
In principle: the two fields take over the variable and value labels from your sav file. In the vast majority of cases, the label is displayed in the charts as the caption.
The most important exception is that for questions the Short_label is displayed in the navigation and used for the chart headings.
Below you can read up on this in a little more detail if required-
Label: The label is later displayed as the caption in the respective charts. Depending on the entry_type there are small differences here:
-
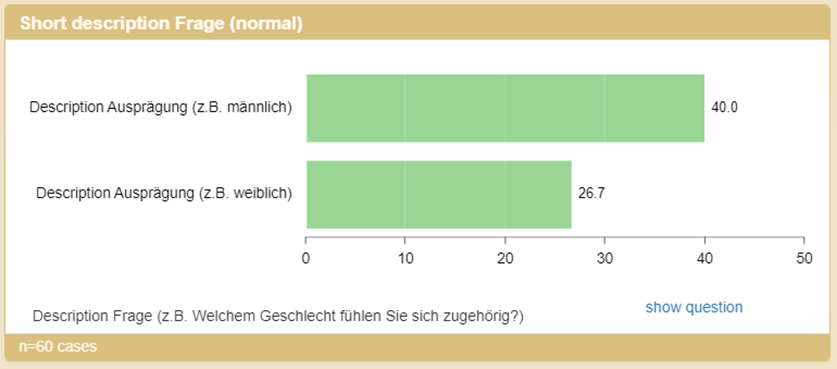
For Entry_type = Frage: The label takes over the information of the variable label (SPSS data set; for csv files the variable name). The label is shown at the bottom edge of charts (as a rule the original question text; it can be hidden).
-
For Entry_type = Ausprägung: The label takes over the information of the value label (SPSS data set; for csv files the value of the answer category) and is displayed in the chart.
-
For Entry_type = Merkmal: If questions are combined online, the label of the item takes over the label of the underlying question. It is later displayed in the chart (as a rule as the category caption).
-
-
Short_label: For entry_type “Frage”, the short_label is used as the heading of the respective chart. This can be overwritten manually directly in the chart. Depending on the entry_type, the short_label also has different effects.
-
For Entry_type = Frage: The short_description likewise initially takes over the information of the variable label (SPSS data set; for csv files the variable name). The short_label is displayed in the title when charts are created (as long as it has not yet been adjusted manually in the chart, a change in the codebook is applied). So here you can name questions exactly as the charts are to be captioned later. In addition, the short_label is shown in the navigation.
-
For Entry_type = Ausprägung: Here the label of the associated question is taken over. As a rule this information is not displayed (if filters are set, the information appears in the chart footer)
-
For Entry_type = Merkmal: If questions are combined online, the short_label of the item takes over the short_label of the underlying question. It is not displayed.
-
-
-
Chart_type: This defines the chart type a question is created as (e.g. bar or pie chart). By default a bar chart is created (b-bar); the chart type can be changed on the dashboard at any time later on.
-
Settings: Question-specific settings can be made here (e.g. color schemes, special handling of missing values, etc.; you can find more on this here).
-
Display: Here you can set whether and as what a question is to be shown in the navigation. By default, variables are displayed both as a question and as a filter (empty, 0 or 1). Further options: -1 (do not display the variable), 2 (display only as a variable), 3 (display only as a filter).
-
Level_1: A navigation structure can be created here. By default, all variables are placed in a “Variables” folder. It is possible to add further “folders” and thus structure the questions by replacing “Variables” with another term of your choice. If further navigation levels with subfolders are needed, add a new column (level_2) and name the entries accordingly (e.g. level 1: “Questionnaire data” and level 2: “Attitudes” and “Usage data”).
Making smaller changes in the online codebook
-
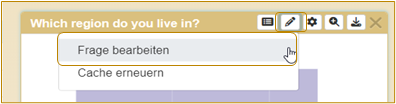
If you want to edit the variable underlying a chart, click the pencil icon at the top of the chart and then “Edit question” (alternatively, you can switch directly to the backend and navigate to the question through the folder structure under “Codebook”).
-
You are forwarded to this variable in the project backend (new browser tab).
-
Under “Description” (the “label” field from the Structure chapter) you can adjust the question text that can be displayed at the bottom of the chart.
-
Under “Short description” (the “short_label” field from the Structure chapter) you can adjust the chart title (it is displayed as the default when the chart is inserted; it is overwritten by manual changes in the chart).
-
Under “Charttype” (the “chart-type” field from the Structure chapter) you can change the default chart type used when inserting into the dashboard.
-
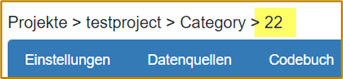
At the very top you will find the unique_id as a number at the end of the path above the blue navigation bar.
-
Save the changes at the bottom of the page. Go back to your dashboard (as a rule still an open tab). Reload the page to see the changes. If you want to change the answer categories of the question, click the answer category you want at the bottom of the page. Here you can change the display text in the chart under “Description” and, if required, adjust the assigned values and the underlying variables (dropdown).
Advanced work with the Excel codebook – download, edit, upload
Download
-
Navigate to the backend (click your name at the top right and then Project; alternatively, in the editing bar of a chart on the dashboard you can click the pencil and then “Edit question”).
-
Click “Codebook” in the blue navigation bar.
-
Under “Codebook”, click “Export Codebook”.
The default setting is “Excel ohne/without textboxes”. Select this one and save the Excel file in a suitable location.
[Note: It is best to download the current state of the Codebook and copy the file, then continue working with the copy. That way you can restore the current state at any time.]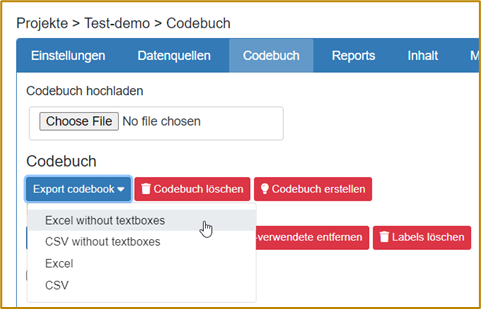
Editing
The codebook gives you a great many options for adapting your project. The most important ones are outlined here as examples. You can find further information in the help center.
Creating stacked questions (more information here)
To combine individual questions into a question block that can be inserted into a dashboard as a whole, create a stacked question.
-
Copy the questions that you want to merge into a new variable.
-
Insert a row above it; this becomes the new “question”.
-
Change the entry_type “Frage” to “Merkm”. The label of the Merkm is later displayed in the chart as the category name. Enter “multistack” as the chart-type.
-
Assign individual IDs (“unique_id”; these must not already exist anywhere else in the codebook) and the same new question ID.
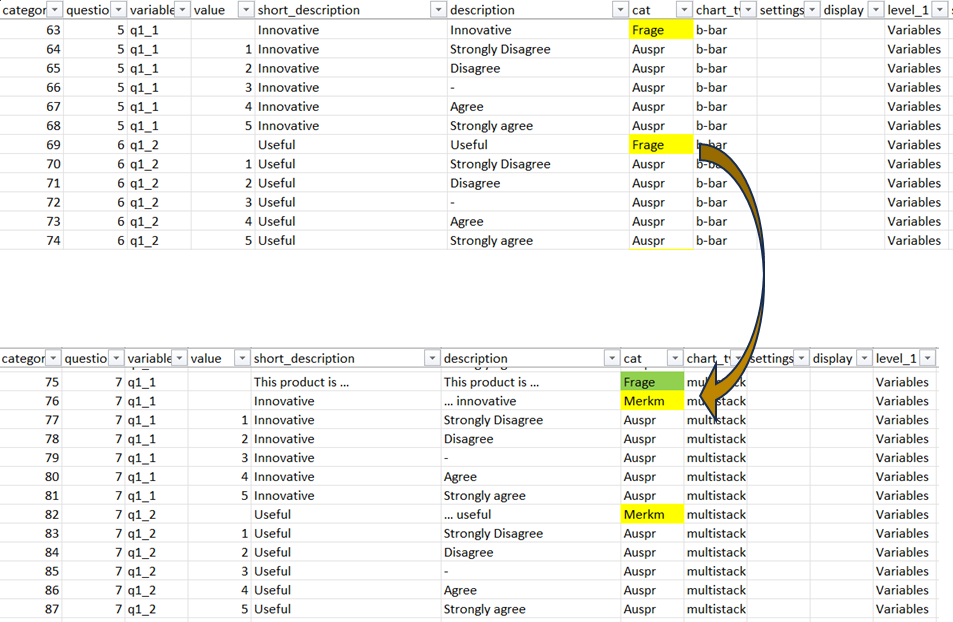
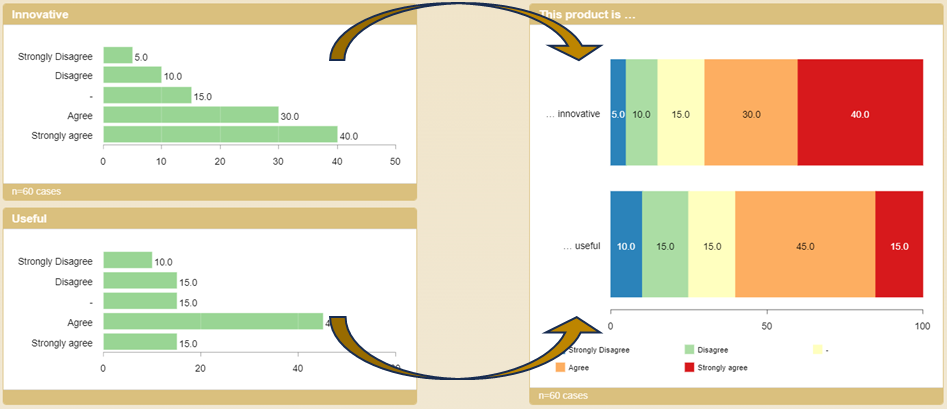
This lets you transform several normal bar charts into a stacked bar chart:
Multiple responses (more information here)
-
We recommend creating a question with only those answer categories that mean “selected” (copy the question and delete the answer categories that mean “not selected”).
-
Assign individual IDs and the same question ID.
Adjusting labels
Change the captions in the “Label” and “short_label” columns. You can read above under “Label and Short_label” exactly what is displayed where.
Adding new answer categories
If new answer categories are added to variables with a new data upload, you can add them in the codebook as follows:
Insert a new row (this can – but does not have to – be inserted directly below the last answer category that already exists).
Example: the answer category “East” (= 3 in the data set) is added.

-
The following information is taken over from the previous answer category (green): question_id, variable, short_label, entry_type, chart_type, level_1
-
The following information has to be entered (yellow): ID_unique (unique number), Value (the value that occurs for “East” in the data set, here: “3”), Label (caption of the answer category, here “East”).
Recoding/calculating variables (you can find more information here)
Variables can be recoded or calculated very flexibly in the codebook, for example to form new groups, to calculate variables, etc. This works as follows:
-
Create a new variable:
Insert a new row for the question: entry_type = Frage, category_import_id and question_id must be unique, fill the other columns accordingly. -
Recodings are made by entering SQL formulas in the rows of the answer categories in the “value” field. Create a new row for every answer category you want (unique category_import_id and the same question_id as the associated question).
-
Identify the variable (in the “variable” field) that is to be used as the basis for the recalculation (e.g. “age” if you want to form new age groups).
The most common recodings/calculations are:
-
Forming new groups/combining answer categories
New groups can be formed with the following operators:-
AND (a case is counted if A and B apply at the same time)
-
OR (a case is counted if A or B applies)
-
= , > , < , >= , <=
-
-
If answer categories are to be newly combined, the formula is given inside two curly brackets and one normal bracket {{(formula)}}.
-
Example 1: forming age groups (the variable is called “age”).
{{(age >= 18 AND age <= 35)}}
—> combines all answer categories into one category in which age is at least 18 and at most 35 at the same time; new category “18-35 years”. -
Example 2: combining categories, e.g. school-leaving qualifications: Abitur (1) and Fachabitur (4) are to be combined (the variable is called “abschluss”).
{{(abschluss = 1 OR abschluss = 4)}}
—> combines the answer categories 1 and 4 into the new category “(Fach-)Abitur”.In this way, any new categories you like can be formed.
-
Calculating new variables (more information here)
-
Variables can be formed with all common arithmetic operators and SQL commands.
-
If variables are to be calculated, the formula is given inside two curly brackets including an equals sign {{=(formula)}}
-
Example 1: calculating the mean of a variable manually (e.g. the number of people in the household; the variable is called n_HH).
{{= AVG(n_HH)}}
—> calculates the mean of the people living in a household.
Note: SQL formulas can also be used in text boxes on the dashboard.
-
-
Caution! Notes on the codebook
-
Id_unique: values may only occur once.
-
Question_id: a question, including all of its items and answer categories, must always be assigned the same question_id, and this must be unique for that question.
The question entry must have the lowest unique_id within the question_id) -
Every question entry needs at least one answer category; every question needs a question entry
-
As a rule, every entry needs an associated variable from the data set (exception: a formula is used in value)
Upload
-
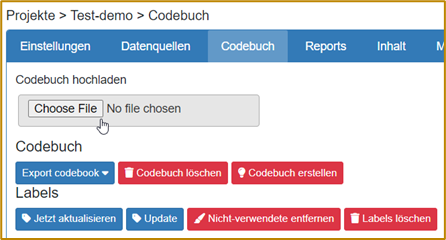
In the backend, navigate to “Codebook”.
-
Under “Upload codebook”, click “choose File” and select the revised codebook (if you do not have a backup yet, download the current state first)
-
Click “Save” at the bottom of the page.
-
Have the codebook checked - to do this, click the green “Check Codebook” button at the bottom of the page.
-
If everything is in order, “Codebook looks good” is shown in green.
-
If there are still inconsistencies in the codebook, you can take the errors from the red box, search for them in the codebook, clean them up and have the codebook checked again (click Cancel and upload the codebook again).
The most common sources of error are:-
Duplicate row IDs 1. The category_import_id “1” was assigned more than once.
-
Different levels for question 1: Variables2, Variables. Question 1 has different levels in the “Level” column. A question including all items and answer categories must have the same level.
-
Several question entries for question 2. The question_id “2” was assigned more than once.
-
Field name in row 23 not found. The entry in Excel row 23 is missing the underlying variable in the “variable” column.
-
Afterwards, assign the respective “codebook column” to the corresponding function in the “online codebook”:
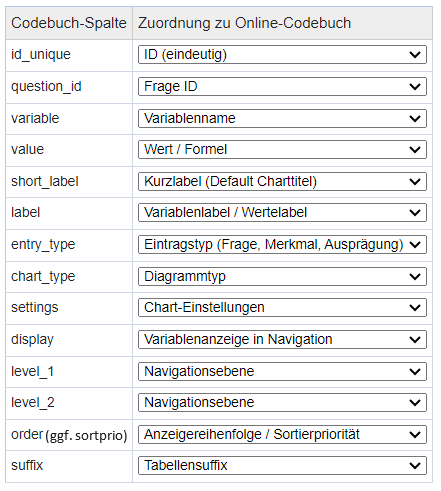
-
-
Click “Save” at the bottom of the page.
-
You will see a progress bar showing the upload progress.
[Important! For very large Codebooks the upload can take several minutes. During this time the dashboards are temporarily unavailable. If this is critical, please schedule the upload for times at which no or only few users want to reach your dashboards.]
After the upload you are directed back to the backend. The changes are now applied to your project. Any captions that have changed update automatically in the charts (unless configured otherwise; the page has to be reloaded).
4. Configuring the start page
The start page can be created in two ways:
-
A dashboard is defined as the start page.
You can design this very easily with text boxes.
At the top right you can add text boxes to the dashboard by clicking the “plus”. By clicking the edit icon at the top left of the text box you can work with it like a text editor (insert text, tables, links, photos, etc.) -
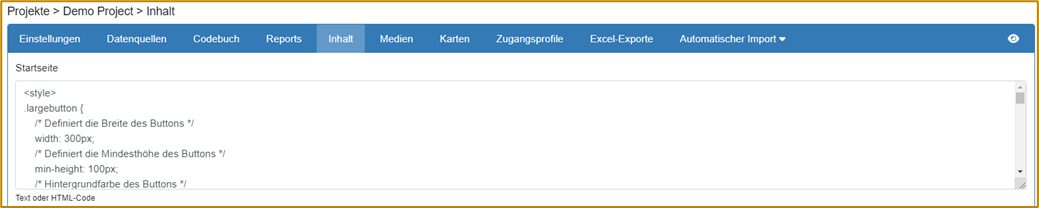
A start page is designed with css and html elements (recommended for advanced users only). You can implement the code in the project backend under “Content” → Start page. You can find more information here.
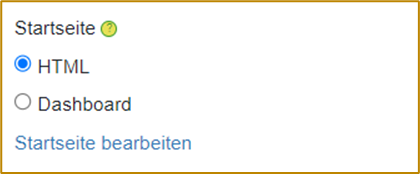
In the project backend, set the option you want in the “Settings” tab under “Display options”.
[Note: If you want to select a dashboard as the start page, the report first has to be set to “Public” in the project frontend in the report settings (gear icon at the top left). Only then does a dropdown menu appear in the project backend under Content in which you can define your desired dashboard as the start page.]
5. Design adjustments
The design (colors, backgrounds, default colors for the charts that are created) can be adjusted very well manually via css. You can find instructions on the following pages:
-
Creating your own theme: https://datalion.zendesk.com/hc/de/articles/4409265627154-Eigene-Themes-mit-CSS-erstellen
-
Storing your own color scheme: https://datalion.zendesk.com/hc/de/articles/360028594992-Individuelle-Farbschemata-nach-Frage-Variable-anlegen. The color scheme is created and saved under “Administration” → Charts and colors → Color schemes → New
6. User administration (backend)
Basics
DataLion has extensive rights management. Rights are distinguished at the following levels:
-
Instance (permissions for all projects on the instance).
-
Project (permission for all reports in a project).
-
Report (permission for individual reports including dashboards).
People can be assigned the following roles:
-
Admin (access to everything, including access to the instance administration and the project backend: user administration, project creation, data import).
-
Editor (report and dashboard creation in the frontend).
-
Viewer (access to reports, no option to save).
In addition, access profiles can be defined at project level; these can further specify the display of certain content and filters as well as the options for changing the dashboards.
Roles are generally assigned at the user level.
Only the release of individual reports takes place in the report settings.
More on this topic here.
Creating users & assigning rights
-
Navigate to the instance administration (click your name at the top right and then “Administration”).
-
Select “Users” on the left.
-
Click “New” at the top right to create a new user.
-
When creating the account you can define the assigned user role at instance level (admin, editor, viewer).
-
Point out to the new user that the password should be reset promptly.
-
Save the entry at the bottom of the page.
-
Click “Projects” in the blue navigation bar at the top.
-
Here you can assign the user rights for certain projects on your instance (user role). If required, an access profile can also be assigned (this must be created in the project beforehand so that it can be selected here).
-
In addition, at the very top you can define which project the user is to be directed to after logging in (the defined start page is displayed).
7. Exports
Exporting a report or dashboard
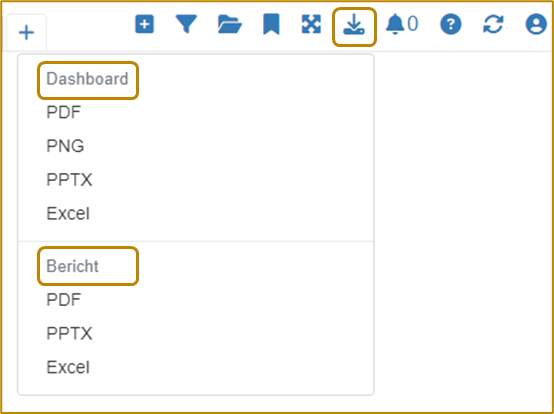
In addition to the option of using and presenting your data directly in the DataLion web application, DataLion also offers various export options. You can export either complete reports, individual dashboards or individual charts as a PDF, PowerPoint presentation or Excel file. To do this, select the “Download” icon in the top right frontend area (or when hovering over a chart) and export the file in the format you want.
Integrating a PowerPoint master
You also have the option of integrating a PowerPoint master into your project, so you can export the PPTX file directly in your corporate design, for example.
- To integrate your prepared master into your project, navigate to the backend of your project. You can find information on configuring your master here.
[Note: When creating your master in PowerPoint you must close the slide master view before saving.]