
Create a stacked chart with multiple items (combining questions)
Stacked charts differ from other chart types because they do not display the values as separate bars but stacked on top of each other - usually with several bars, that is, with data from different variables. Combining individual variables with stacked data from the same answer scale into a single chart is easy in DataLion.
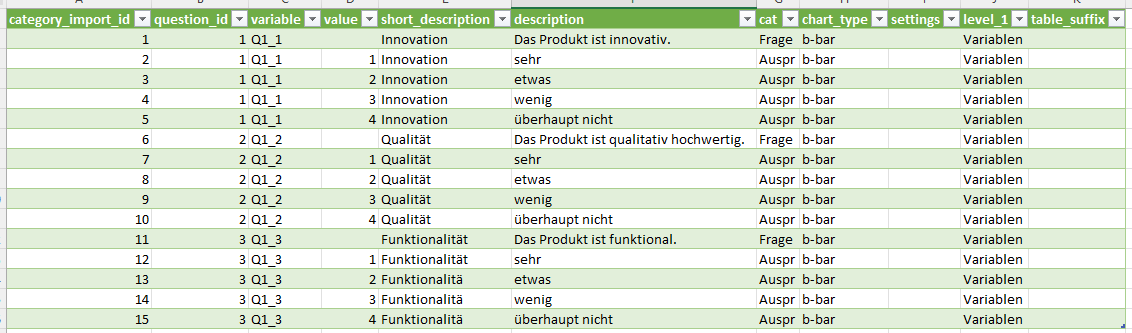
Starting point, automatically created codebook: Every variable is created as a separate question in the codebook. Each item belonging to question Q1 (Q1_1, Q1_2, Q1_3) is therefore created by DataLion as a separate question.
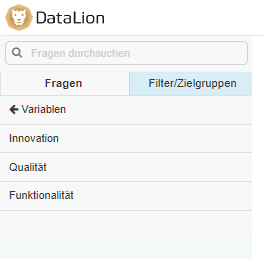
In the frontend, the questions can be dragged onto the dashboard individually from the side navigation to create separate charts.
But you want to display the questions as stacked bars underneath each other in one chart?
There are three options:
Option 1: Combine questions in the frontend (“merge”)
This approach is suitable if you want to combine a question ad hoc for your dashboard but do not want to save it in the codebook for use on other dashboards.
-
Create a first chart.
-
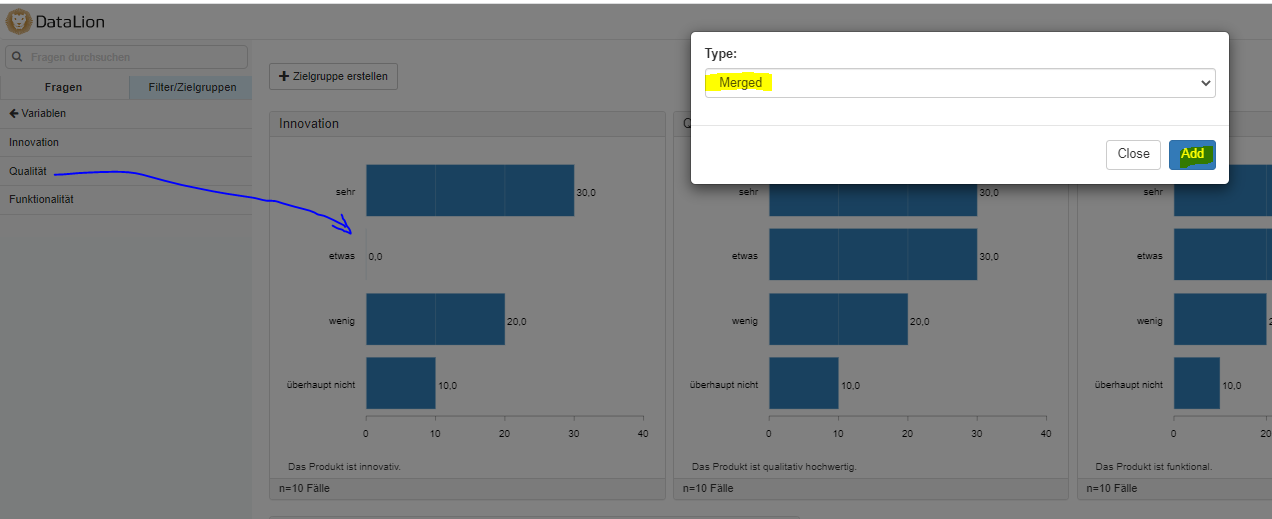
Use drag & drop to pull a question that should be combined onto the existing chart.
-
Choose “merge” to add a question to the existing chart.
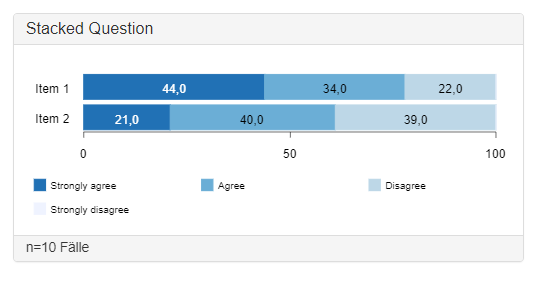
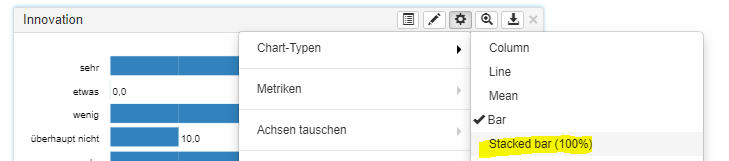
- Once all questions have been dragged onto the chart, choose the chart type “Stacked bar” in the chart menu > chart types
Result:
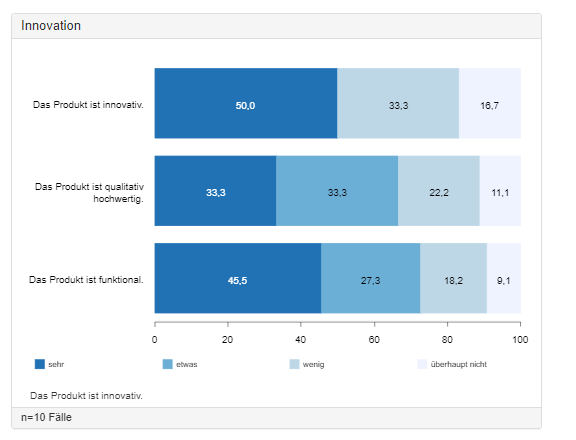
The chart header can be adjusted by double-clicking on it, and the description “The product is innovative” at the bottom of the chart, which is unnecessary in this case, can be hidden via the chart settings.
Option 2: Combine questions in the online codebook
This approach is suitable if you want to extend the codebook so that you can reuse the new combined question throughout the entire project.
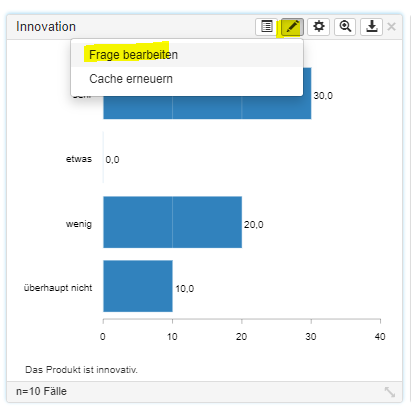
- Click “Edit question” in the chart header to open the codebook in the project backend.
- In the codebook, click on the short description of the question (here “Innovation”) to move up one level out of the question.
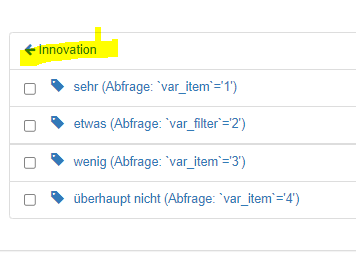
- Select the questions that should be combined and click
Merge.
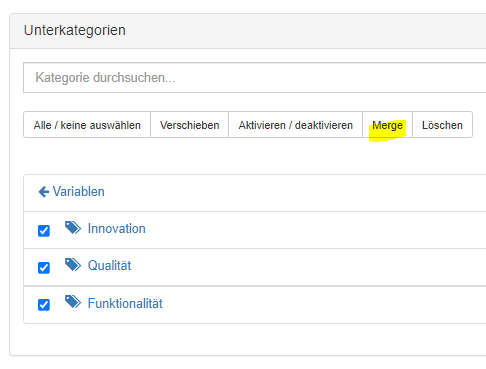
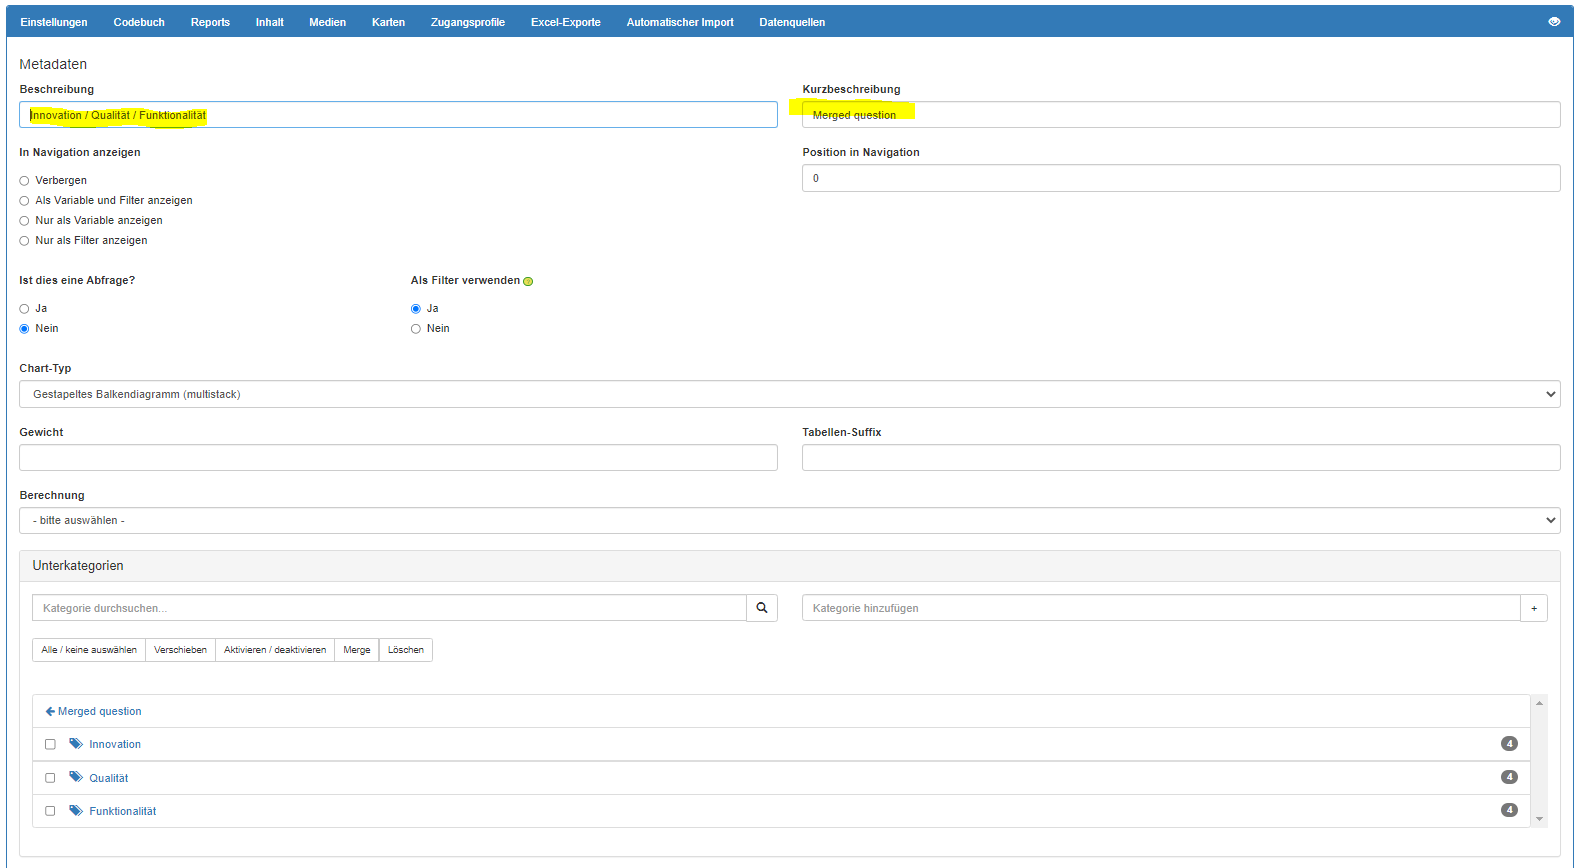
- A new, combined question has been created. The description and short description can be adjusted if necessary.
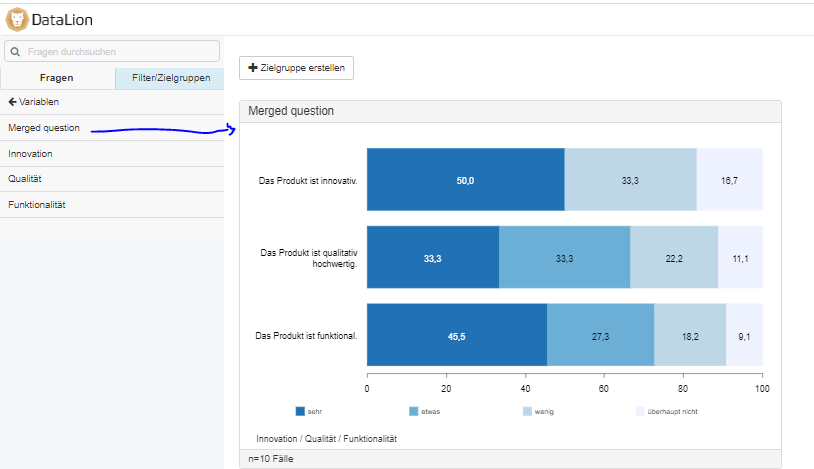
- The combined question is now available throughout the project in the side navigation. In the frontend you can now simply drag & drop the combined question from the side navigation onto the dashboard to build a chart.
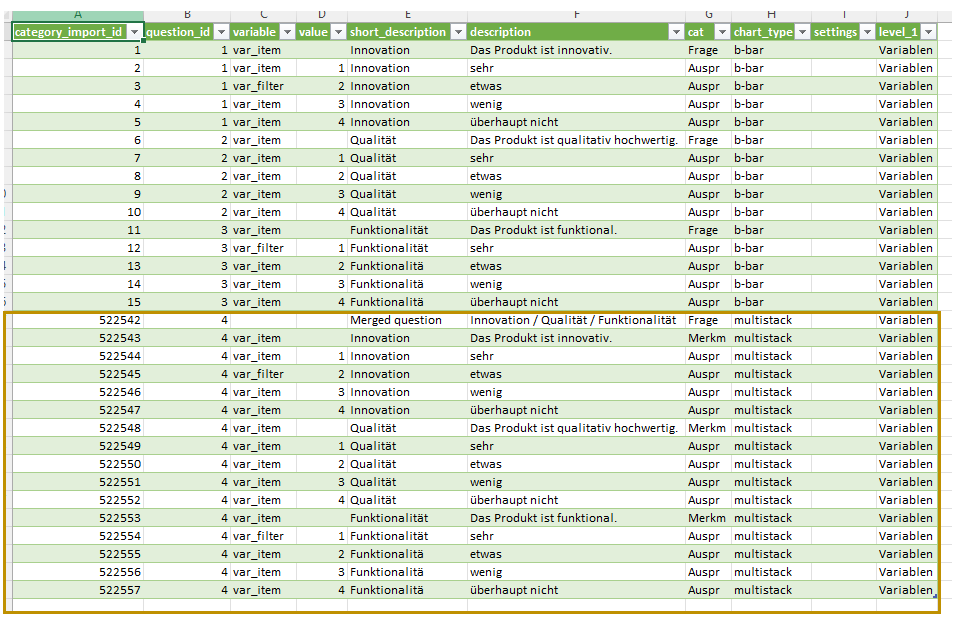
By the way: in the background, the software has extended the codebook with the stacked question. If you export the codebook, you will see the new entries for the stacked question.
Option 3: Add the stacked question manually in the offline csv codebook
Instead of using the online codebook as described above, you can also extend the codebook with new questions manually. Simply add the new rows in the external csv codebook and then import the adjusted codebook.
Important: In the codebook column Cat, one row is created for the question. The individual items (here Innovation/Quality/Functionality) are marked with “Merkm”, the categories of the answer scale (very - not at all) with “Auspr”.
The codebook then looks as follows and can be imported via “Upload codebook” in the project backend > Codebook.