
Manage tracker waves
In trackers and recurring surveys, every case belongs to a wave. In DataLion you manage these waves explicitly, with a label, field period, case count and status, while all cases stay in the same project table. Dashboards get a wave filter, timelines use the waves as their time axis, and when readers pick a wave, DataLion compares it with the previous one automatically.
Requirements
- DataLion release 2026.2.195 or later.
- An account with access to the project settings.
- A variable in the dataset that holds the wave, such as “Survey wave” with the values 1 and 2.
Derive waves from the data
- Open the project under Admin → Projects and choose Waves under Data in the navigation.
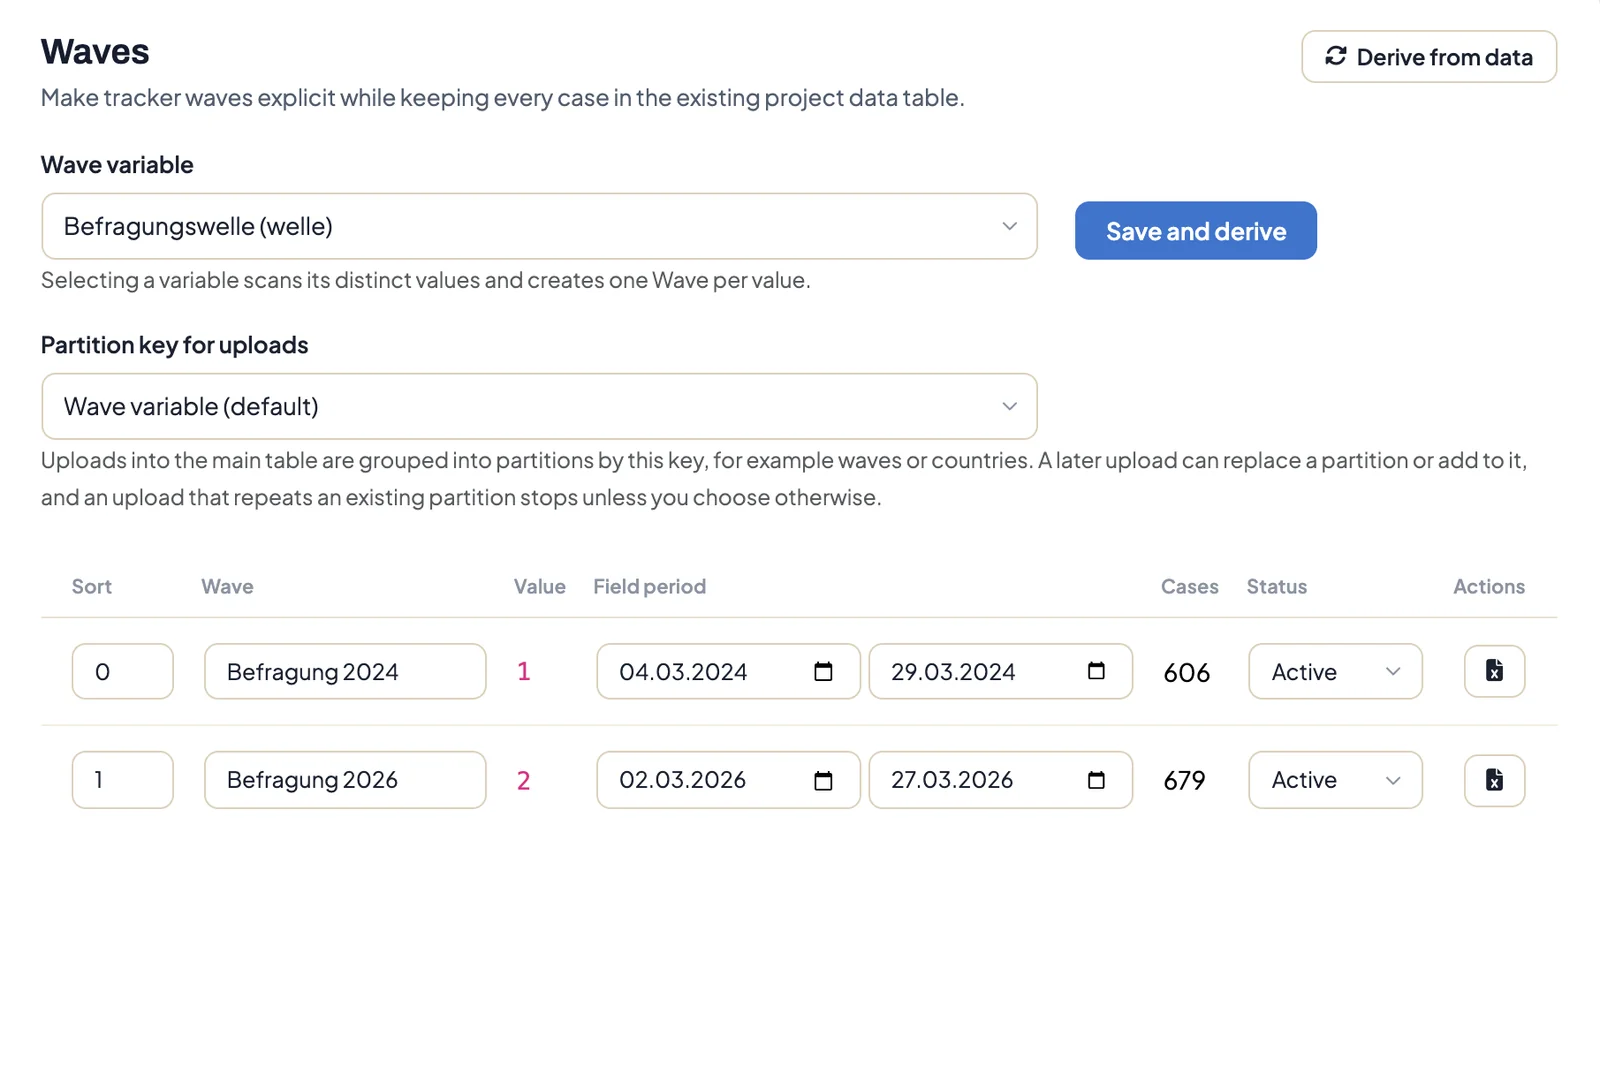
- Under Wave variable, pick the variable that holds the wave.
- Click Save and derive. DataLion creates one wave for each value of the variable and counts the cases.
If new values come in later, click Derive from data at the top. DataLion adds new waves and recounts the cases. Labels, order, field periods and status of existing waves stay as they are.
Maintain waves
The table shows for each wave:
- Sort: the order of the waves. It decides which wave counts as the previous one.
- Wave: the label readers see in filters and charts, such as “Survey 2026” or “Q3 2026”. If a wave came from an upload, its upload number appears below.
- Value: the value of the wave variable in the dataset
- Field period: start and end of fieldwork
- Cases: the number of cases in the wave
- Status: Active, Closed or Archived. DataLion hides archived waves in filters and doesn’t use them as the comparison wave.
Change the label, order, field period or status and save with the bar at the bottom. DataLion also writes the label and order to the codebook.
You can’t delete waves or create them by hand here. They come from the data.
Waves in the dashboard
Once a wave variable is set, dashboards get a Wave filter with All waves as the default.
- If readers pick exactly one wave and no other comparison is set, DataLion uses the previous wave as the comparison. Significance tests against the comparison then test the change from the previous wave.
- In timelines, choose Wave under Time interval in the chart menu. To make it the default for the whole project, set it under Analysis defaults → Date and time → Default time interval.
- Maps with a breakdown by wave get a wave slider, see Available chart types.
Export a wave
In the Actions column, click the Excel icon (Export this wave to Excel). You get an Excel file with all raw data for that wave. Very large waves don’t fit on one Excel worksheet, and DataLion tells you so.
Upload new waves
Load new waves into the same project table as a data update, see Data updates. For uploads with a wave variable set, the preview shows a Wave harmonization check listing new, missing and relabeled variables compared with earlier waves. From release 2026.2.198, the Partition key for uploads on the Waves page also controls whether an upload replaces or adds to an existing wave. The details are in Upload new waves without duplicating data.
Tips
- Use clear labels such as “Q1 2026”. Readers see them in every filter and chart.
- Keep variable names identical across all waves so questions stay comparable over time.
- Archive test waves or faulty waves instead of deleting the data. They stay traceable but don’t interfere with comparisons.