
Scored surveys and personal results
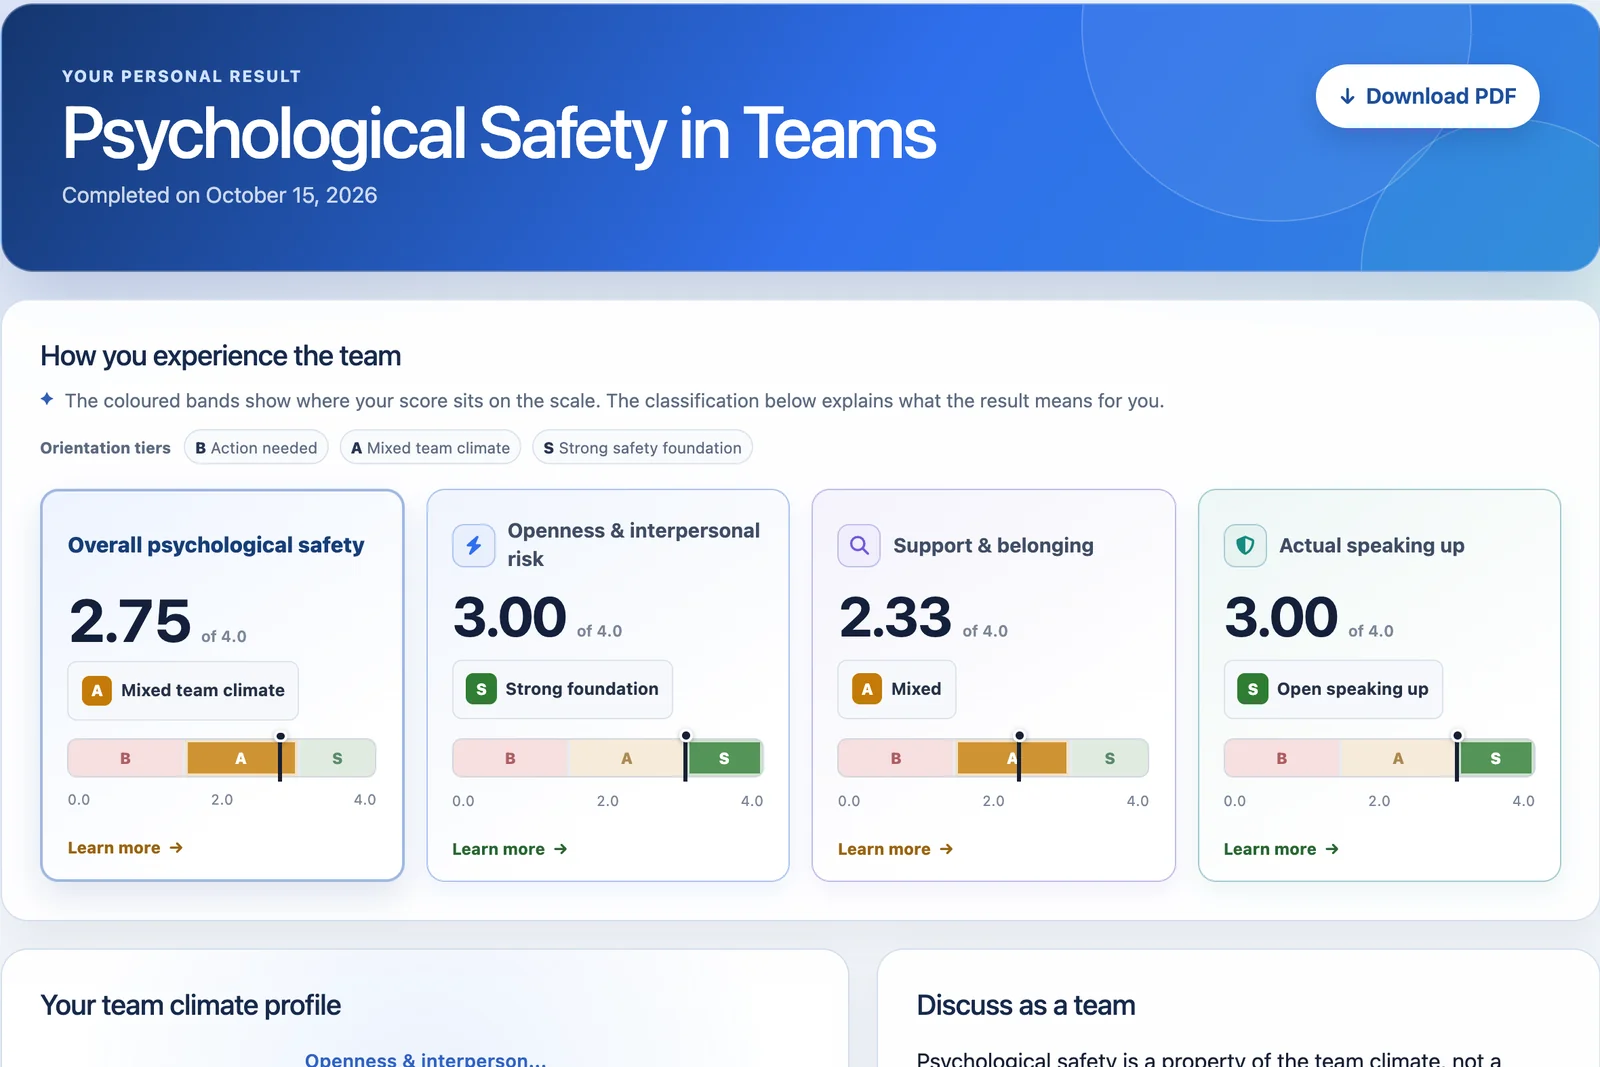
In a scored survey, DataLion turns the answers into points, places them in bands and shows each person their result after they submit. Typical examples are self-assessments, maturity checks, competence assessments and validated questionnaires such as the WHO-5. The scores also land in the dataset as variables, so you can analyze them in the dashboard like any other question.
Requirements
- DataLion release 2026.2.196 or later. Score position on the scale, group averages and the renamable professional report arrived in 2026.2.197.
- An administrator account and a survey in Draft status.
- The quickest start is a template under the Personal result filter, see Create a survey from a template. Scoring and the result page are already set up there.
Turn on scores
- Open the survey in the builder and click Survey settings.
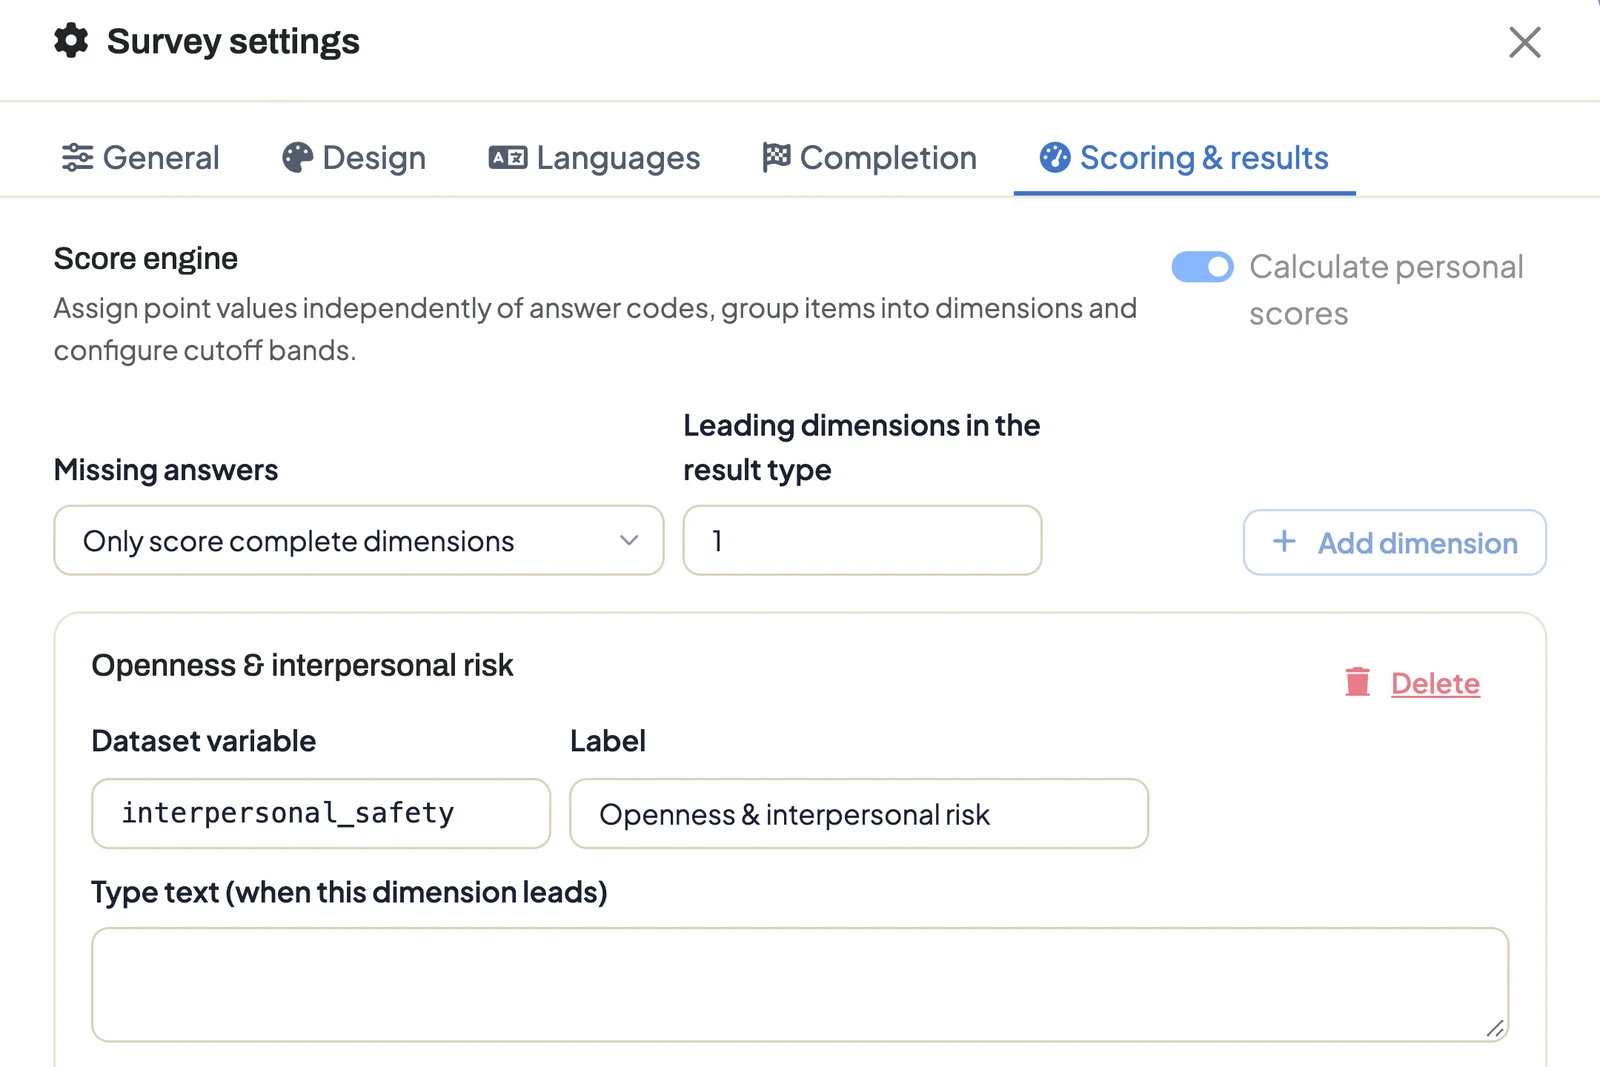
- Switch to the Scoring & results tab.
- Turn on Calculate personal scores.
Define dimensions and points
A dimension combines several questions into one value, for example “Openness & interpersonal risk”.
- Click Add dimension.
- Enter a Dataset variable, the name under which the score appears in the dataset, and a Label for the result page.
- Choose the Aggregation: Sum, Mean or Weighted mean.
- Under Items and points, add the questions with Add item. Enter the Points for each answer. They’re independent of the answer codes. Weight makes a question count more, Reverse flips negatively worded statements.
Scores work with single choice, multiple choice, dropdown, rating scale, NPS, picture choice, emoji scale, consent and the rows of a matrix. For multiple choice, DataLion adds up the points of all selected options.
Under Missing answers you decide what happens when questions are skipped: Use available items, Count as zero or Only score complete dimensions.
Bands and overall score
- Under Cutoff bands, split the value range into bands with Add band. Each band has a Minimum, Maximum, a Class label such as “Strong foundation”, a Color and an Interpretation text. If two bands overlap, DataLion warns you.
- Overall score combines all dimensions into one value. If you choose Weighted mean there, you set a weight for each dimension. The overall score gets its own bands.
- Leading dimensions in the result type sets how many of the highest dimensions make up the result type. Enter the matching text in each dimension under Type text (when this dimension leads). That’s how typologies like “What type of gamer are you?” work.
The personal result page
Under Personal result page in the same tab, you build the page from Report blocks. Add content block offers:
- Score tiles with value, band and position on the scale
- Gauges / traffic lights
- Result type
- Radar chart for several dimensions
- Band interpretations with the texts of the bands reached
- Static content for your own explanations
- Disclaimer
For each block, choose under Visible for whether participants see it (End user), the protected Professional report, or both. Rename the professional report under Professional report name, for example “Counselor” or “Manager”.
What participants see
After submitting, each person lands on their result page. The address is signed, so only someone with the link can open it. Download PDF saves the result as an A4 PDF. From five completed responses, the score tiles also show the group average. Page and PDF appear in the survey’s language.
If you work with a panel, put the {result_url} placeholder into the Complete redirect URL, see Distribute a survey.
The professional report
The professional report is meant for experts who work with the results, such as coaches or managers. Under Collect → Professional report you create Professional links: one signed link per completed response. Whoever opens it has to log in and needs access to the project. By default, the links expire after seven days.
Analyze the scores
On publishing, DataLion writes each dimension and the overall score into the dataset as separate variables, named after the Dataset variable. In the dashboard you can then compare scores by group, wave or department, see From survey to live dashboard.
Tips
- Validated instruments such as WHO-5 or PHQ-4 are screenings, not diagnoses. A disclaimer block on the result page tells participants so.
- Test the calculation with Test survey: fill in the questionnaire once with low and once with high values and check the bands and texts.
- From release 2026.2.198, each dimension also has a Scale type, and there’s a Quadrant chart result block.