
Survey
A survey that hands back a result
Assessments, self-checks and maturity models rarely fail at the questionnaire. They fail at what comes after. DataLion computes scores inside the survey and shows the respondent their personal result the moment they submit.
14 days free · no credit card
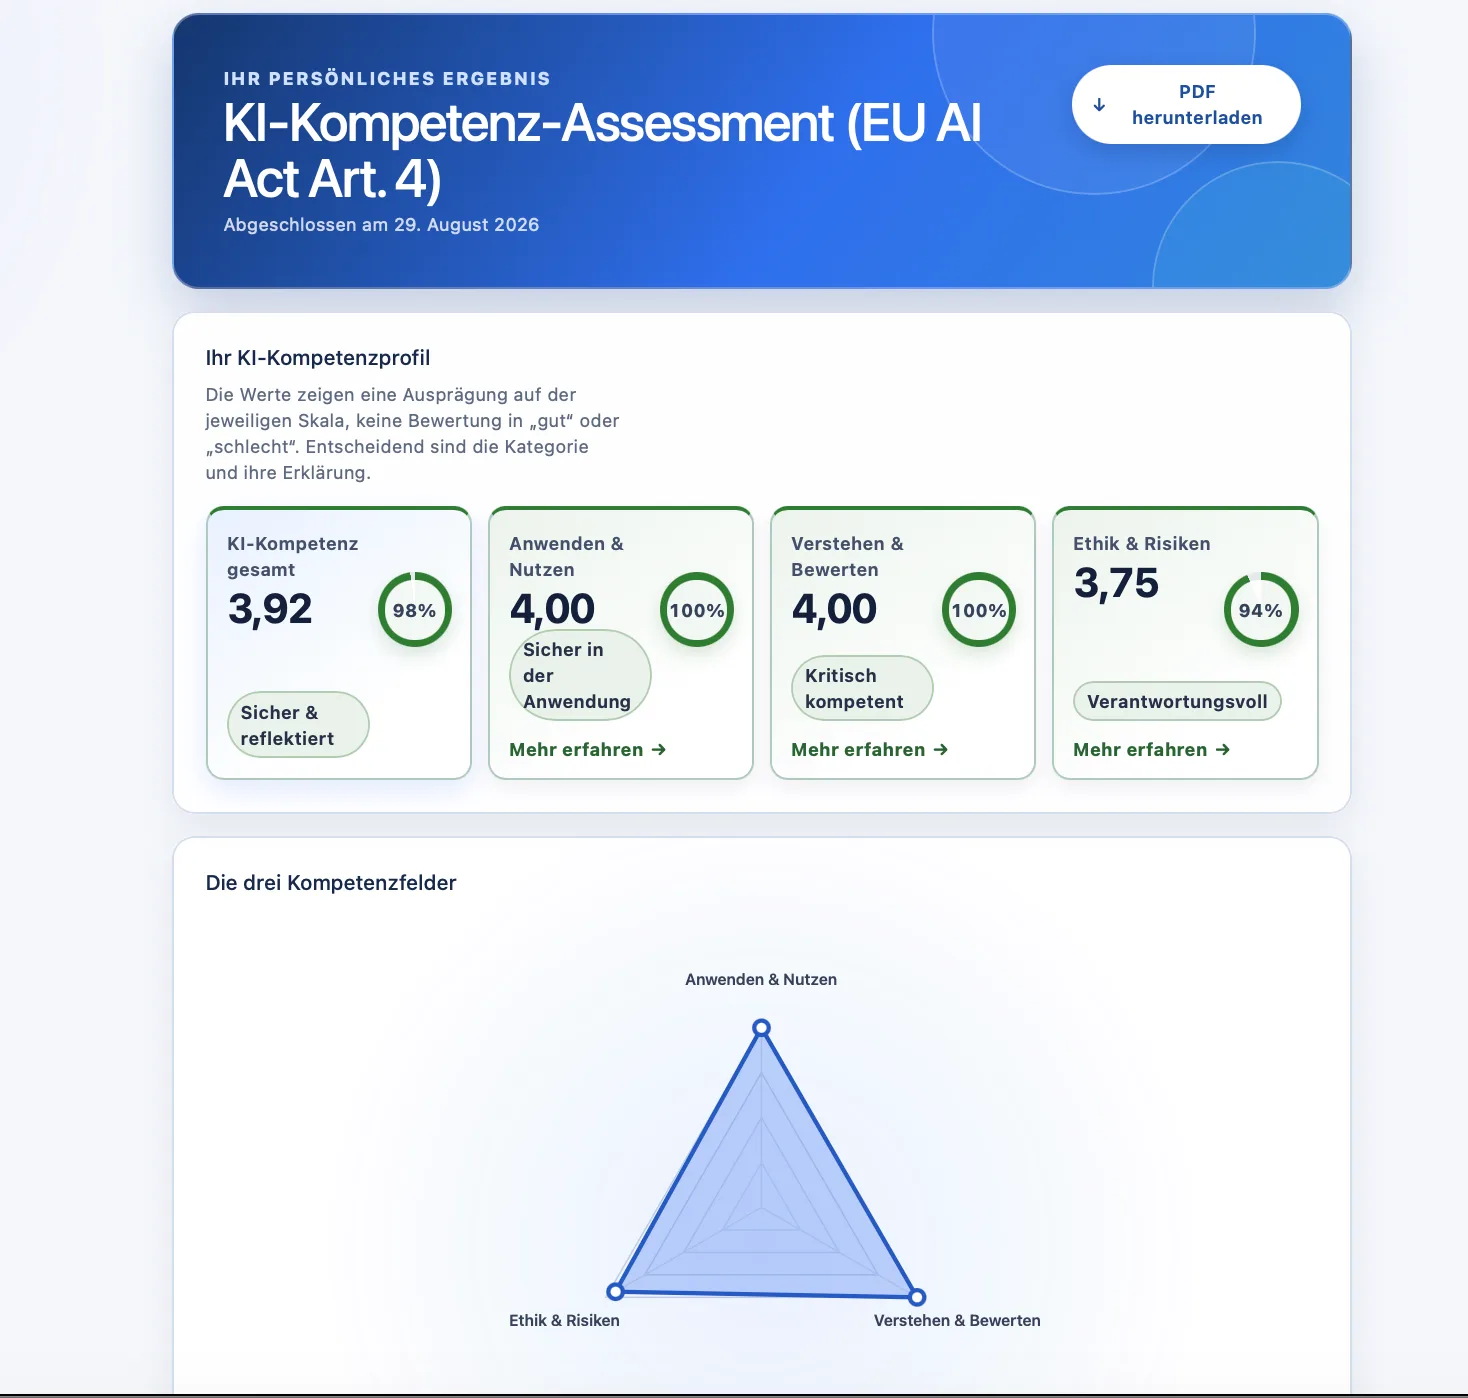
DataLion calculates scores inside the survey itself: you assign points independently of the answer codes, group items into dimensions, weight them into a total score and set cutoff bands for typologies. The respondent gets a personal result page and PDF the moment they submit, and the scores become their own variables in the analysis dataset.
- 🇩🇪 Made in Munich
- GDPR-compliant
- DPA included
- Hosted in Germany
- 🌐 Interface in EN, DE, FR, ES, IT & NL
Trusted by research institutes, brands & insights teams






- 50+ interactive chart types
- 20+ statistical methods
- SPSS · Excel · CSV import without data loss
- ISO 27001 certified data centers (Germany)
The score gets built everywhere except in the survey
- Points are assigned in SQL or Excel, a second calculation path that has to be chased every time the questionnaire changes.
- The personal result is assembled in a mail merge or a reporting tool and reaches respondents days later, if at all.
- Because score and raw data live apart, nobody can later say which version of the point logic a dataset was scored with.
Points, dimensions and weights in one place
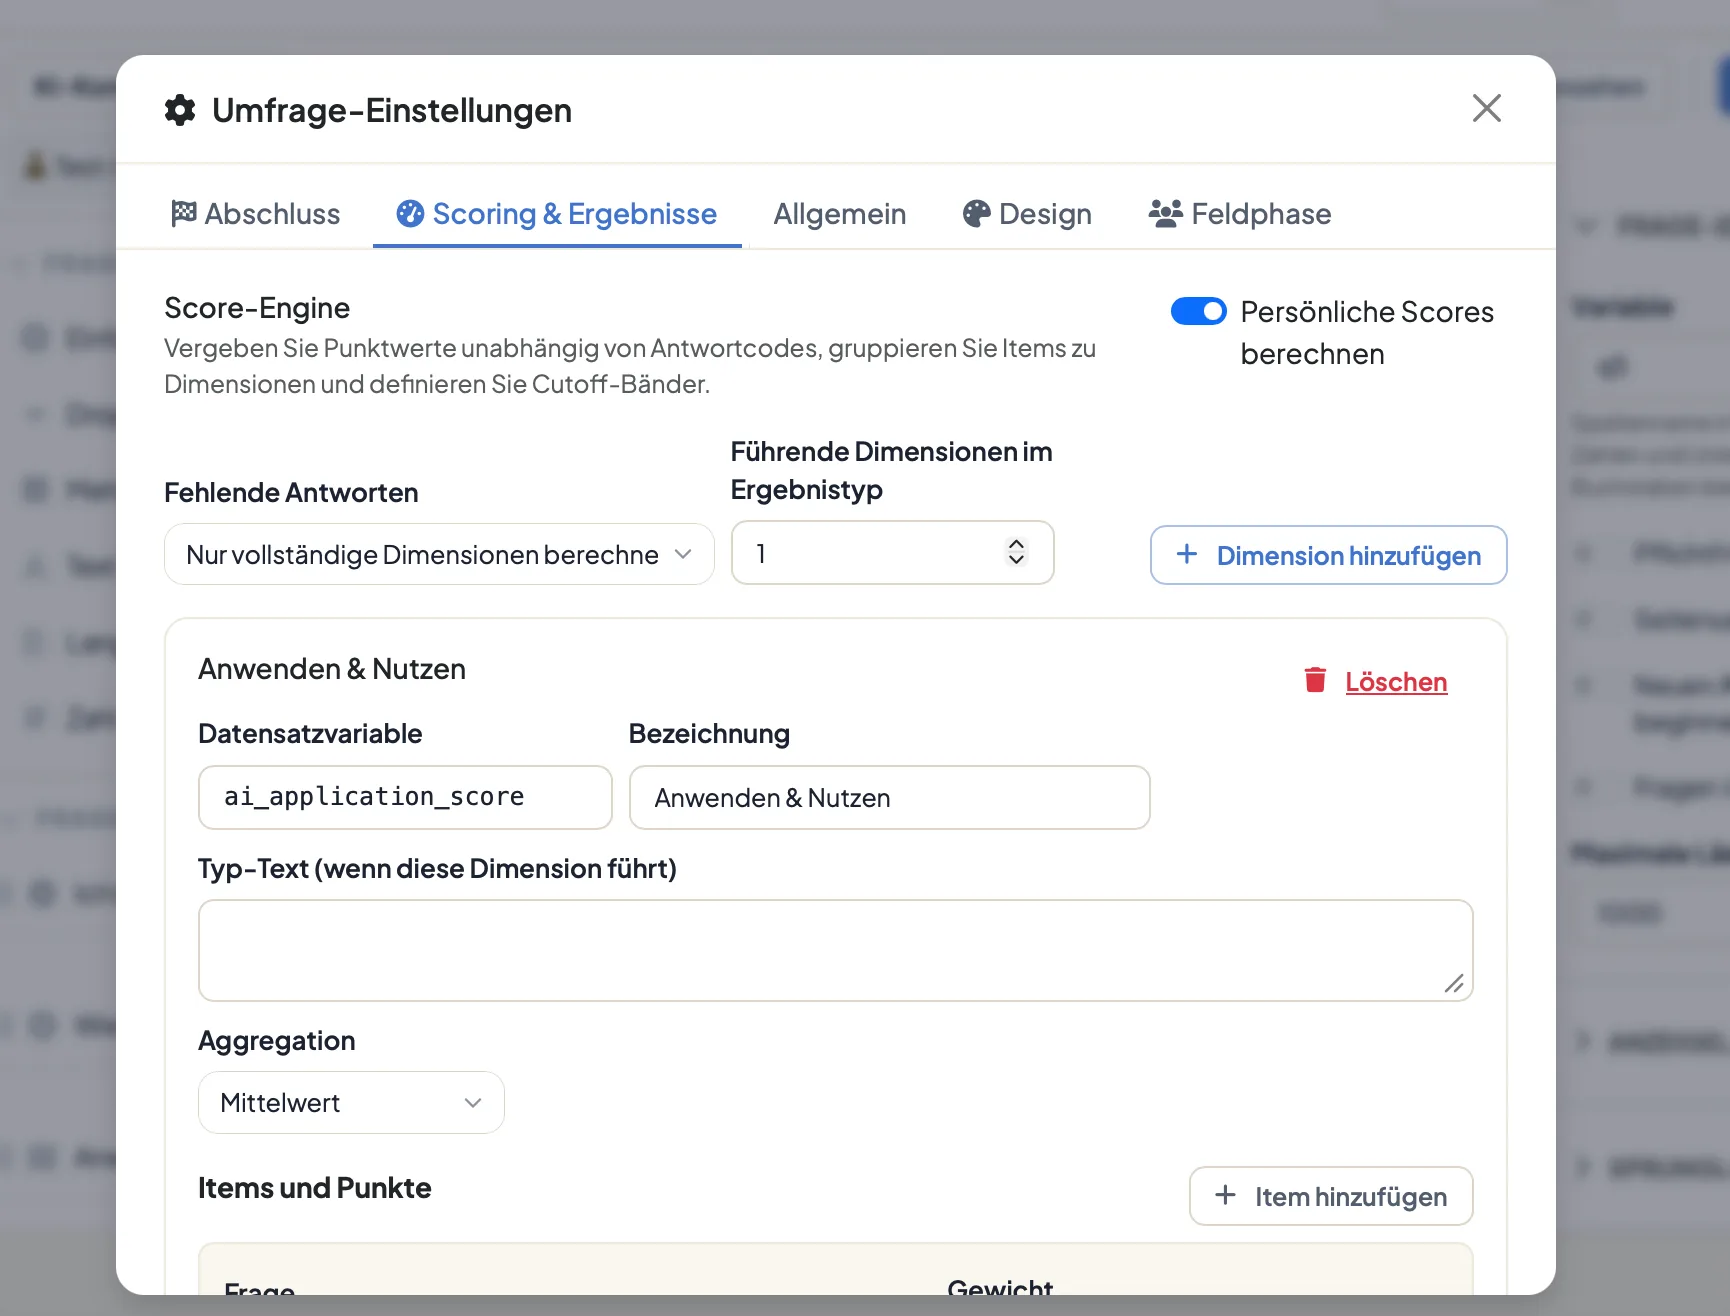
In an open survey under Admin → Surveys you will find the Scoring & results tab. One switch turns on personal scoring, and everything else belongs to the survey and travels with it.
Points are independent of the answer codes. A five-point scale can award 0, 1, 3, 5 and 10 points, and a negatively worded item is marked reverse-scored instead of being flipped in the codebook.
Items group into dimensions. Each dimension gets a dataset variable, a label, an aggregation such as the mean, and an item grid where every item carries its own weight.
- Points independent of the answer codes
- Reverse-scored items without touching the codebook
- Dimensions with their own dataset variable and label
- Aggregation per dimension, weight per item
- A weighted total score across all dimensions
Turning a number into a statement
A score of 3.92 means nothing on its own. Cutoff bands translate the value into a category a person understands: "confident and reflective", "critically competent", "responsible".
Bands can be set for the total score and for each dimension separately. You also choose how many leading dimensions feed the result type, which is what turns several dimensions into a typology profile rather than a ranking.
Missing answers get their own rule. Scoring only complete dimensions gives you an honest "not calculated" instead of a score resting on three items out of ten.
- Cutoff bands for the total score and for individual dimensions
- A type text per dimension, used when that dimension leads
- Configurable number of leading dimensions in the result type
- A missing-answer rule, such as scoring only complete dimensions
The result page that appears on submit
As soon as the survey is submitted, the personal result page opens behind a signed link. It shows the total score, the dimensions with their type label, a profile across all dimensions, and whatever interpretations you wrote.
The same page exists as an archived A4 PDF with proper page breaks, ready to download, print or take into a conversation.
Because assessments read differently depending on the audience, you can store separate interpretations: one for the respondent, one for practitioners, one for coaches. Disclaimers belong on the page too and travel into the PDF.
- Score cards, scales and a profile across all dimensions
- A signed link rather than a guessable URL
- Archived A4 PDF with proper page breaks
- Separate interpretations for respondents, practitioners and coaches
- Disclaimers on both the page and the PDF
Scores are ordinary variables
Every dimension gets its own dataset variable, so scores belong to the analysis dataset and behave like any other variable. You filter on them, average them, cross them against segments and put them into crosstabs.
That answers the question the individual result page deliberately leaves open: how do the types spread across departments, regions or waves, and which dimension is dragging the total down?
For trackers it means an assessment stays comparable across waves for as long as the point logic holds still.
- One dataset variable per dimension, plus the total score
- Filter, cross and average like any other variable
- Type distribution across segments and waves
- Export to Excel, PowerPoint and SPSS
18 assessment templates
Building an assessment from scratch mostly costs time on the point logic. Release 2026.2.196 ships 18 ready-to-run assessment templates with items, points, dimensions and cutoff bands already in place.
A template is a starting point rather than a cage: change items, move weights and rewrite the interpretations in your own voice. More ready-made studies live under templates.
One thing to be clear about: DataLion does not validate an instrument and ships no norm sample. The point logic is yours, and any comparison value comes from your own data.
- 18 templates with point logic already built
- Items, weights and cutoff bands fully editable
- Interpretations in your own voice
- No bundled norm sample: comparisons come from your data
See DataLion with your own data
Start free with your own raw data. Or book a personal demo of the path to a finished dashboard.
What users say about DataLion
- via G2
The embedding function allows us to generate insights of our data for our audience and customers by far less than half of the usual time needed before.
Verified user · Leisure, Travel & Tourism - via G2
User-friendliness, especially for market research topics. Structured backend with many customization options.
Verified user · Market Research - via G2
The contacts at DataLion are very committed. If you have problems, you can count on help. DataLion reacts quickly to requests for new functions.
Robert Q. · Managing Director - via G2
Very professional company, attentive to the customer needs, provider of a great software and service.
Generoso M. · CRM Analyst, Automotive

We now work much more efficiently, giving us more time to take care of the derivations and insights from the data for the customers.
Survey, fieldwork and analysis
Frequently asked questions about survey scoring
Do I still need SQL or Excel to produce scores?
Can points differ from the answer codes?
What does the respondent see after submitting?
Can I store different texts for professionals?
What happens when someone skips questions?
Can I analyse the scores in aggregate?
Does DataLion supply norms or validated instruments?
Build your first assessment with a result page
Start from one of the 18 templates or from your own questionnaire, then look at the personal result before anyone else does.