
Release 200 starts the 2026.3 line. It collects everything finished since 2026.2.199, and most of it is statistics: weighting to several target distributions at once, significance tests that account for weighting, and three new analysis charts.
🚀 Highlights
Weight your data the way market researchers do: Admin → Projects → Settings → Weights now has a Rim weighting panel next to census weighting. Pick the respondent ID and up to ten variables, such as age, gender, region and education, and enter a target share for each value. Every value shows its share in your sample, and each variable has to add up to 100 %. DataLion then adjusts the sample to all margins at once. Unlike cell weighting, this works even when some combinations of the variables have no respondents.
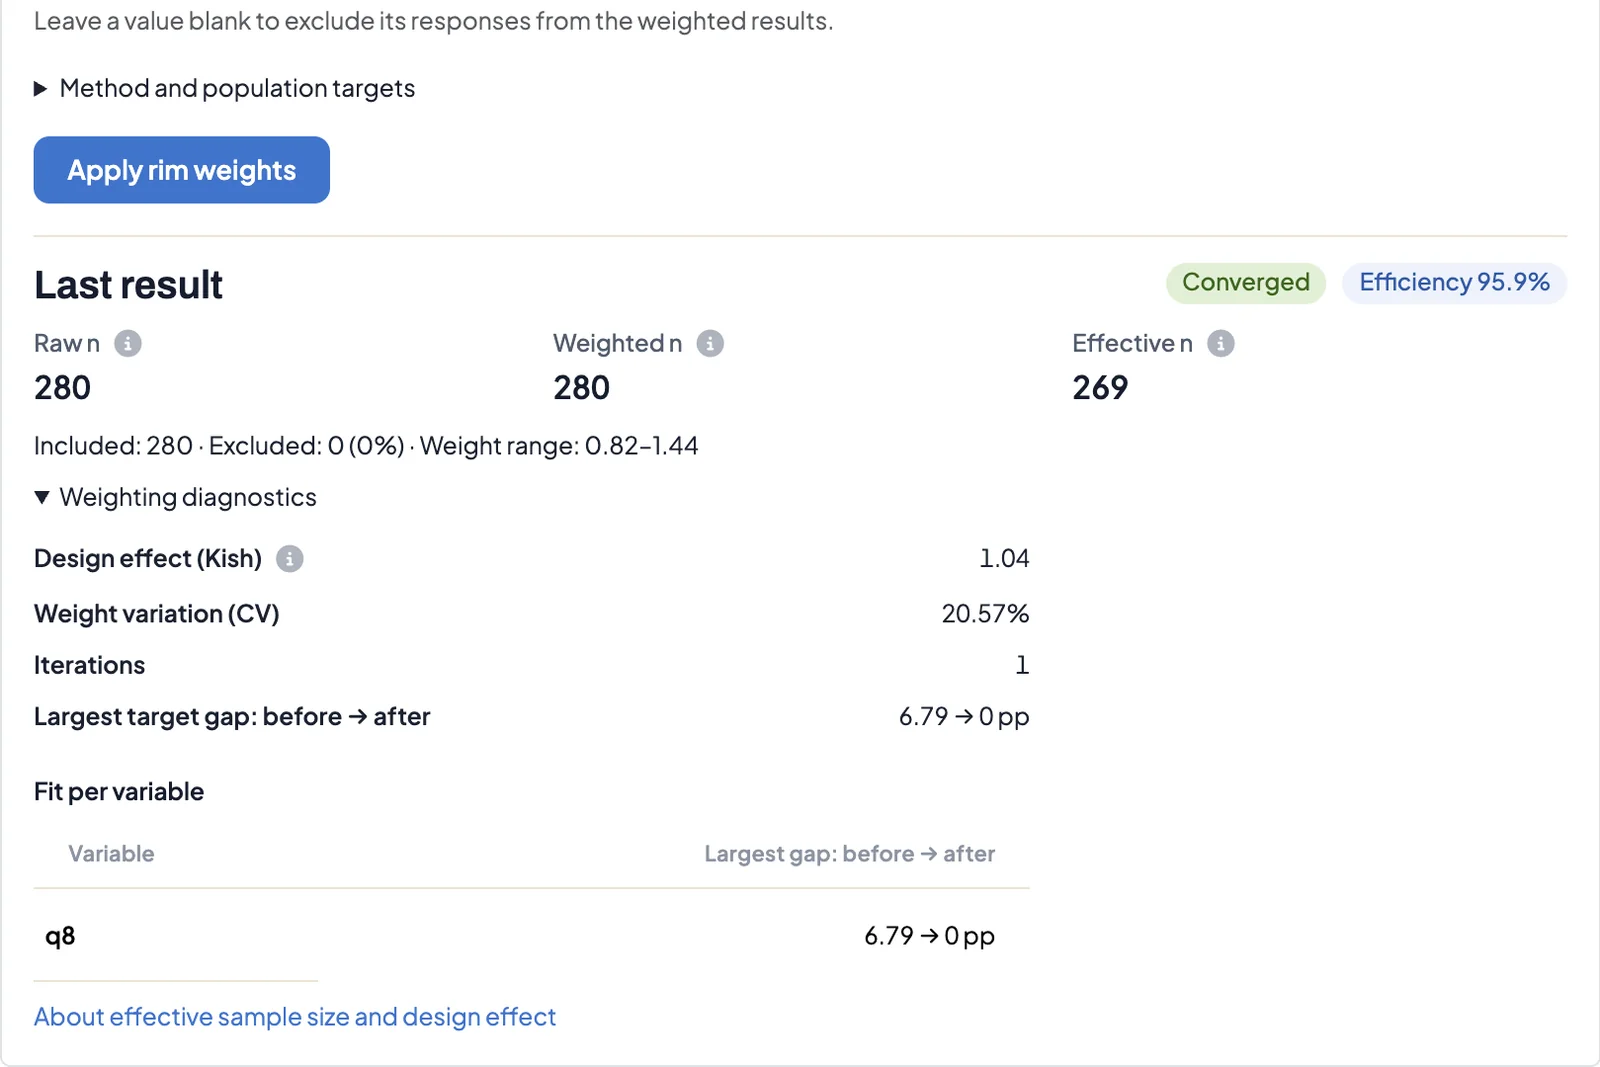
After Apply rim weights, the panel shows whether you can trust the result: raw, weighted and effective n, efficiency, Kish's design effect, the weight range, the number of iterations and, for each variable, the largest gap to its target before and after weighting. Uploaded weight tables are kept. More on weighting in DataLion.
Significance on the effective base: Weighted charts and tables now show Kish's effective sample size next to the base, for example "n=280 cases, n eff.=269". Excel and PowerPoint footers carry the same line. Z-tests and chi-square tests on weighted shares use that effective base. Strong weights make a sample less precise, and the test now accounts for it, so you see fewer differences that only look significant because of the weighting.
When you compare many columns at once, Chart style → Customize → Significances can correct for multiple testing with Bonferroni, Holm or Benjamini-Hochberg. The legend names the method on screen and in every export. More on significance testing.
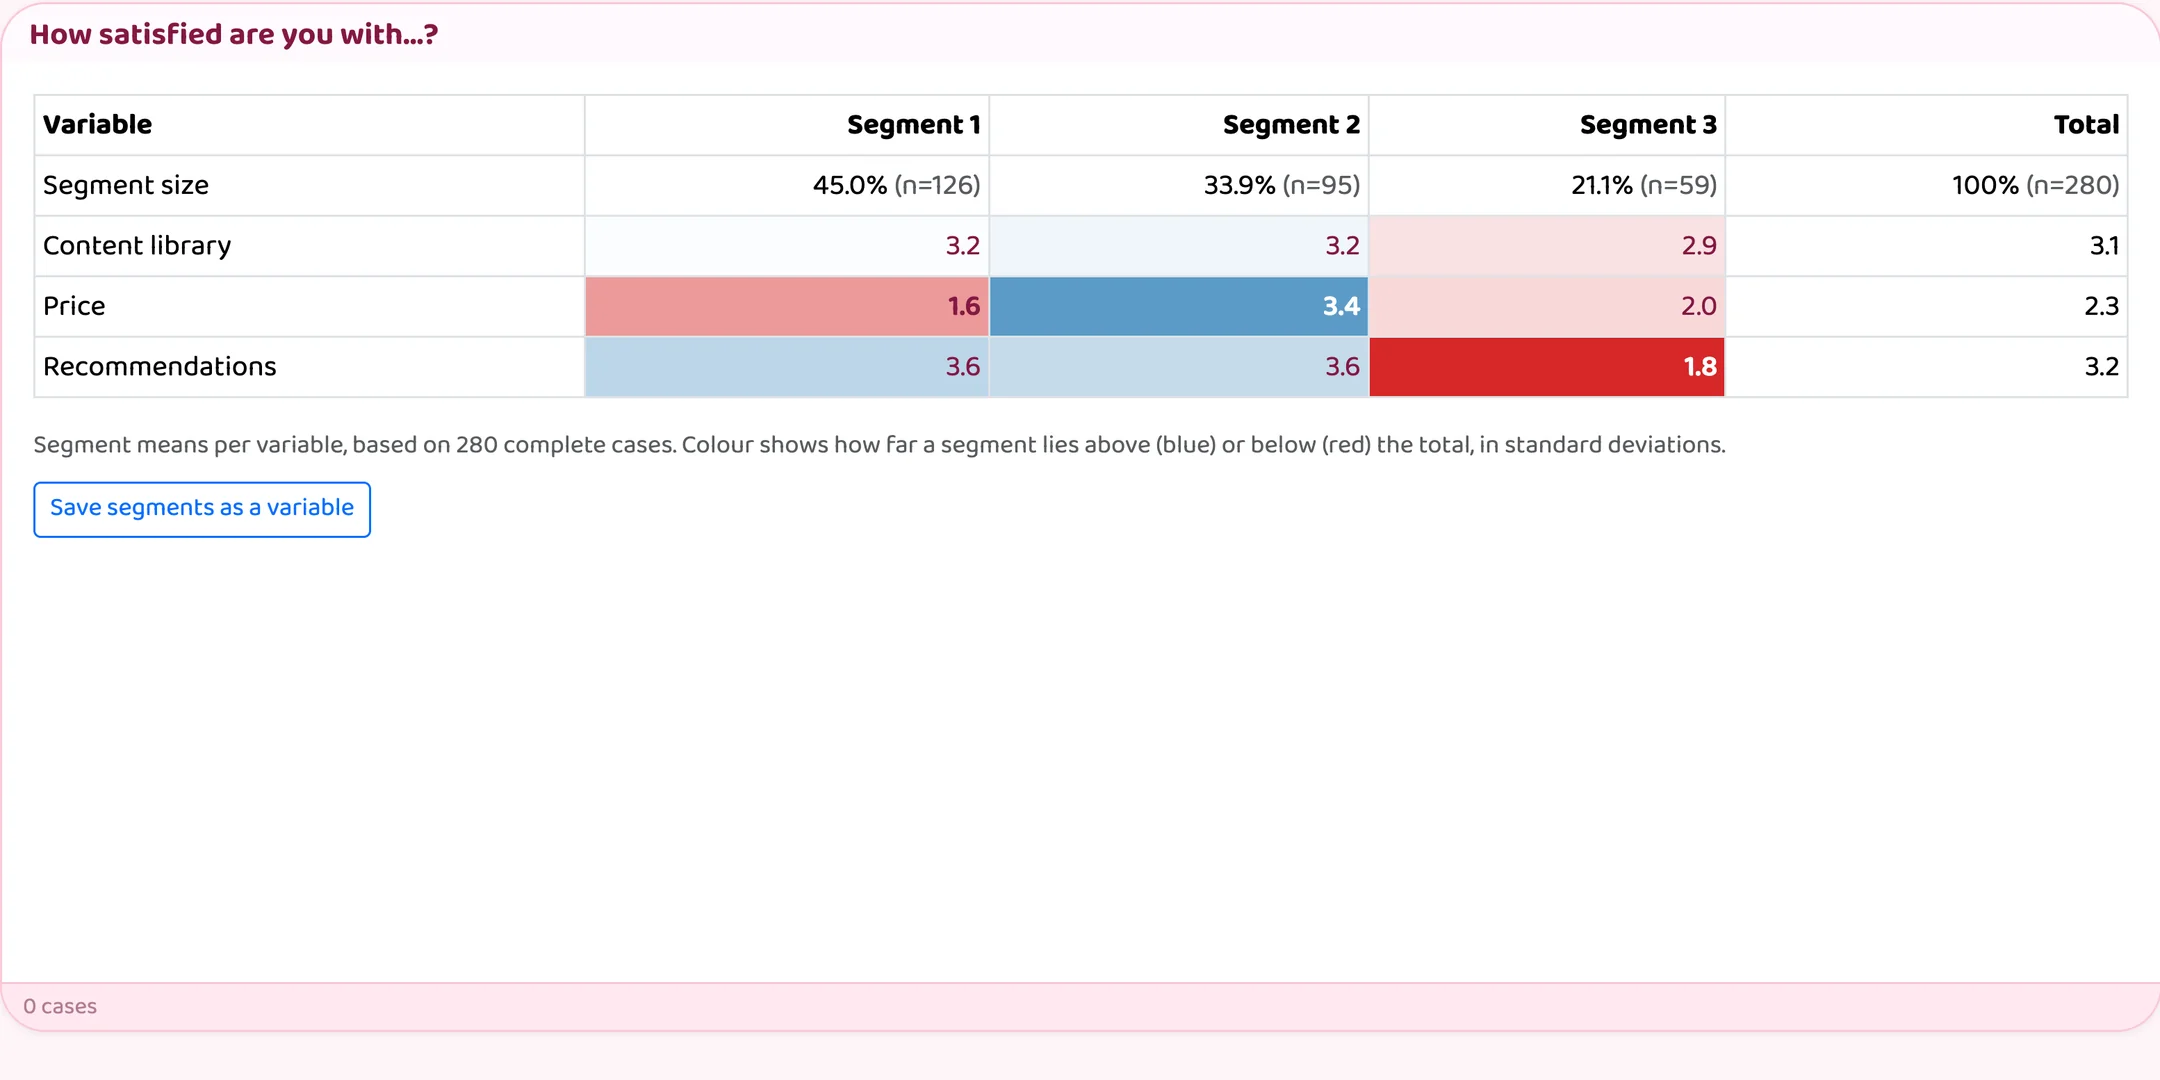
Find segments, reach and spread: Three new analysis charts. Cluster analysis (k-means) splits respondents into segments based on a rating battery. The table shows each segment's means next to the total, shaded by how far it lies above (blue) or below (red), plus its size and n. You set the number of segments or let DataLion choose it. Save segments as a variable turns the result into a question you can filter and break by.
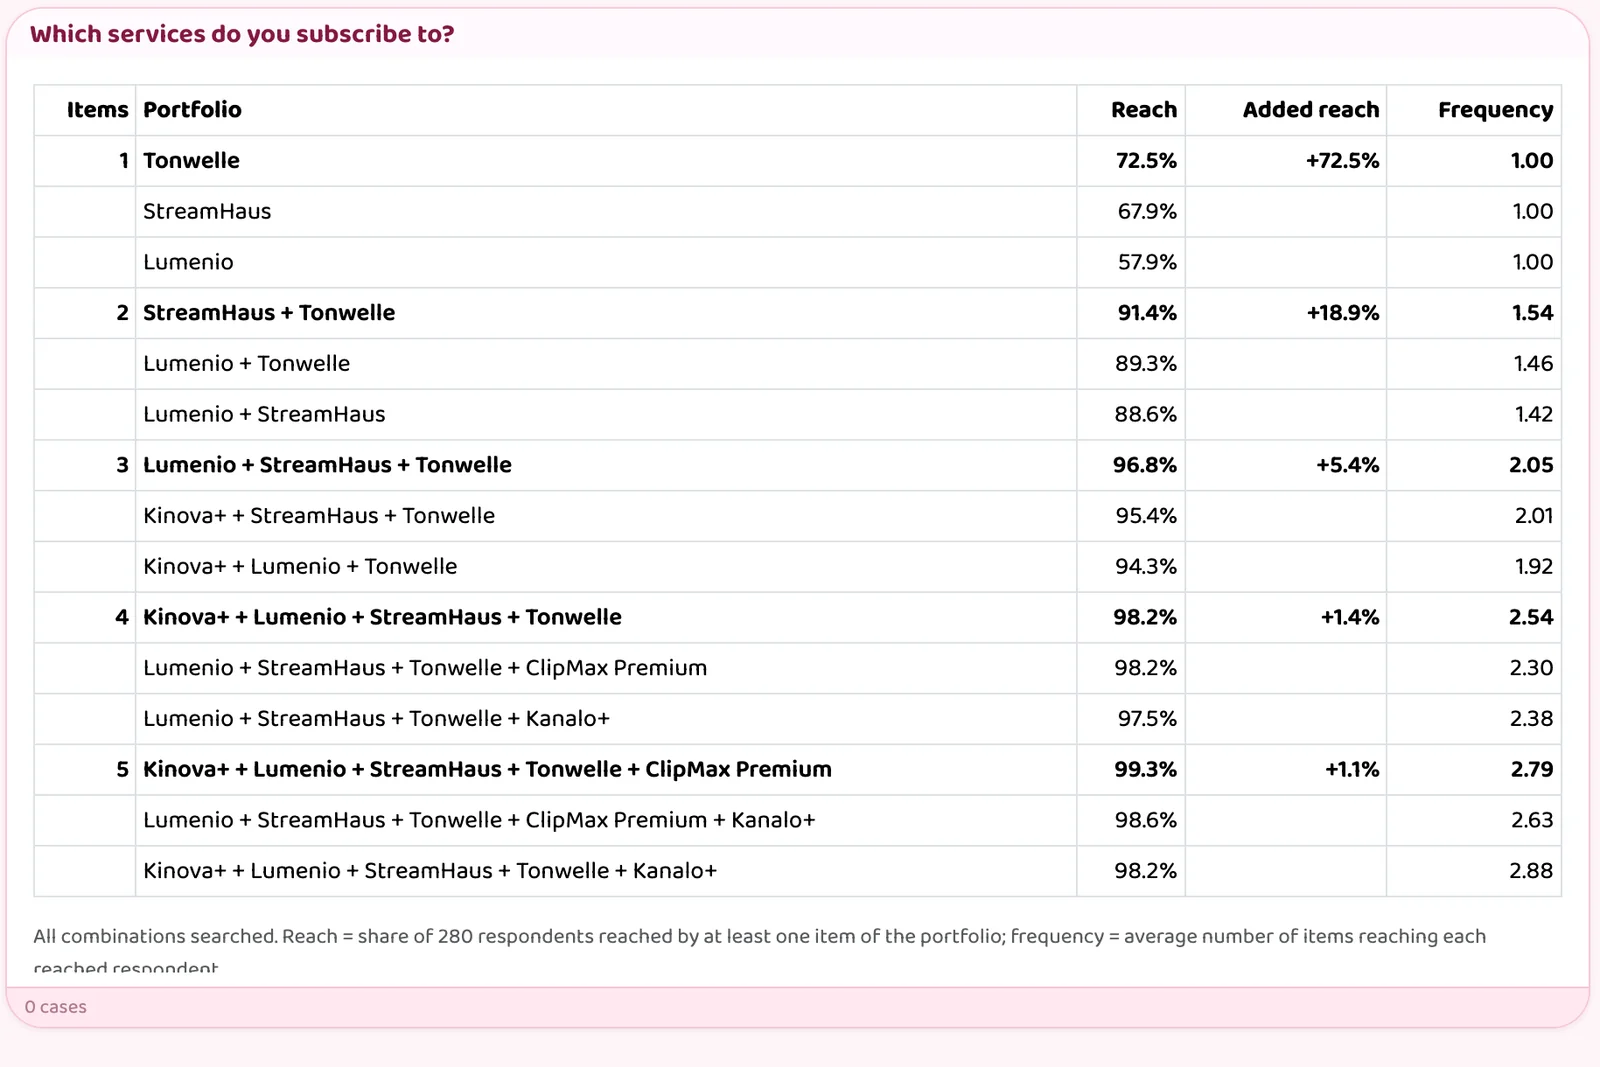
TURF (reach and frequency) answers which combination of products, channels or features reaches the most people. For each portfolio size the chart shows the best combination, its reach, the reach it adds over the smaller portfolio and its frequency, with the runner-up alternatives below. Results are weighted. The Percentile table shows P10 to P90 of a numeric variable per breakdown, also weighted, and exports to Excel and as a native PowerPoint table. All methods are listed under chart types.
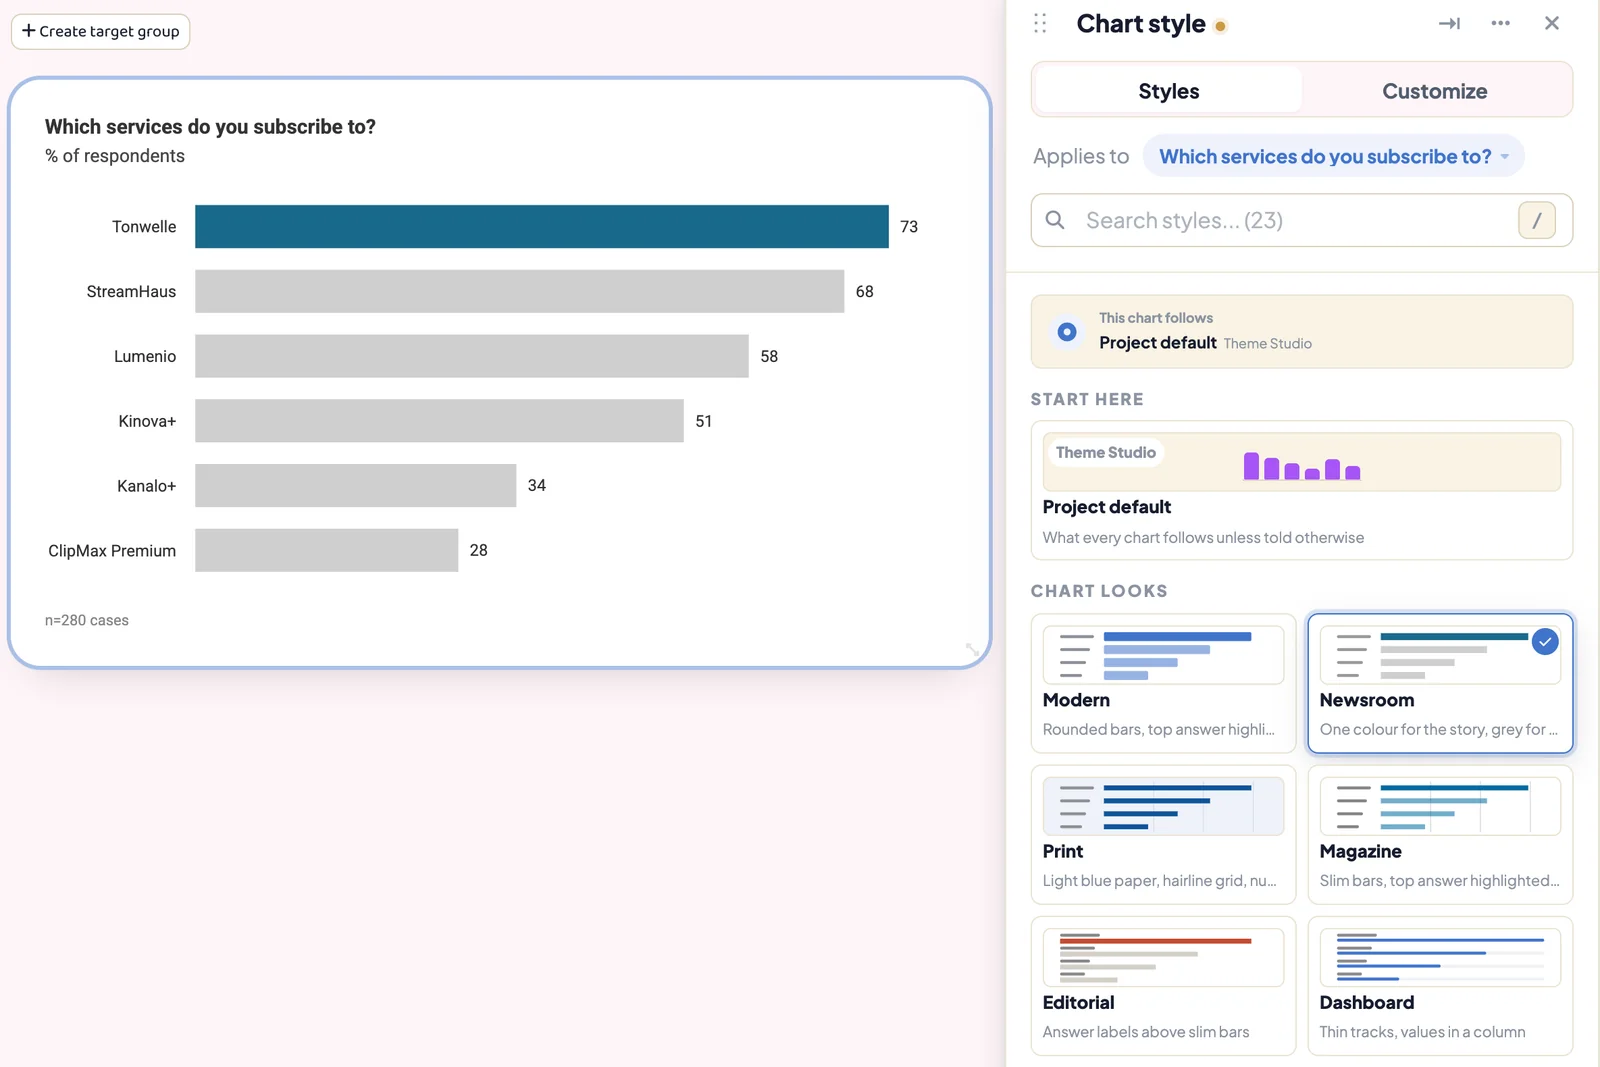
Give your bar charts a designer look: Chart style → Styles → Chart looks offers ten looks, among them Newsroom, Print, Magazine, Editorial, Swiss style and Night. A look sets typeface, colours, title, bar shape and value placement in one go. You can change each of those under Customize → Layout, for example bar thickness, top-answer emphasis, sort order or a net score column. The preview shows every choice on the chart right away.
✨ What's New
📈 Timelines ready for print: Chart settings → Customize → Timelines is now grouped by chart element, the way a format pane works in Excel or PowerPoint. New options include boxed years, a labelled reference line, series names at the line end, circles on the highest and lowest values, significance dots for period-to-period changes, event markers and shaded event periods. Long series keep readable axes, and image and PowerPoint exports keep the look. More on time series analysis.
🔌 Pull surveys straight from LimeSurvey and Qualtrics: Add a connector under Admin → Connectors, then pick the survey under Admin → Projects → Auto imports → Survey platform pull. New responses arrive on a schedule, either in full or only the new cases. The codebook picks up new questions without overwriting your own edits. Respondent tokens, IP addresses and locations are never imported. More on scheduled data updates.
🔁 Update a tracker in one click: The upload review has a new Merge option. It updates cases by their ID, keeps whatever the new file leaves out and appends new respondents. Under Project settings → Waves, a dynamic wave question with the answers Current wave and Previous wave, together with tab defaults such as "↻ Current wave", moves your dashboards on to the new wave after each upload. More on tracker dashboards.
🗂️ Prepare changes before your viewers see them: Admin → Projects → Versions lets admins edit a draft of data, categories, reports and tabs while everyone else keeps seeing the published version. Commit freezes a version and Publish makes it visible. You can discard a draft or restore an earlier version from the history.
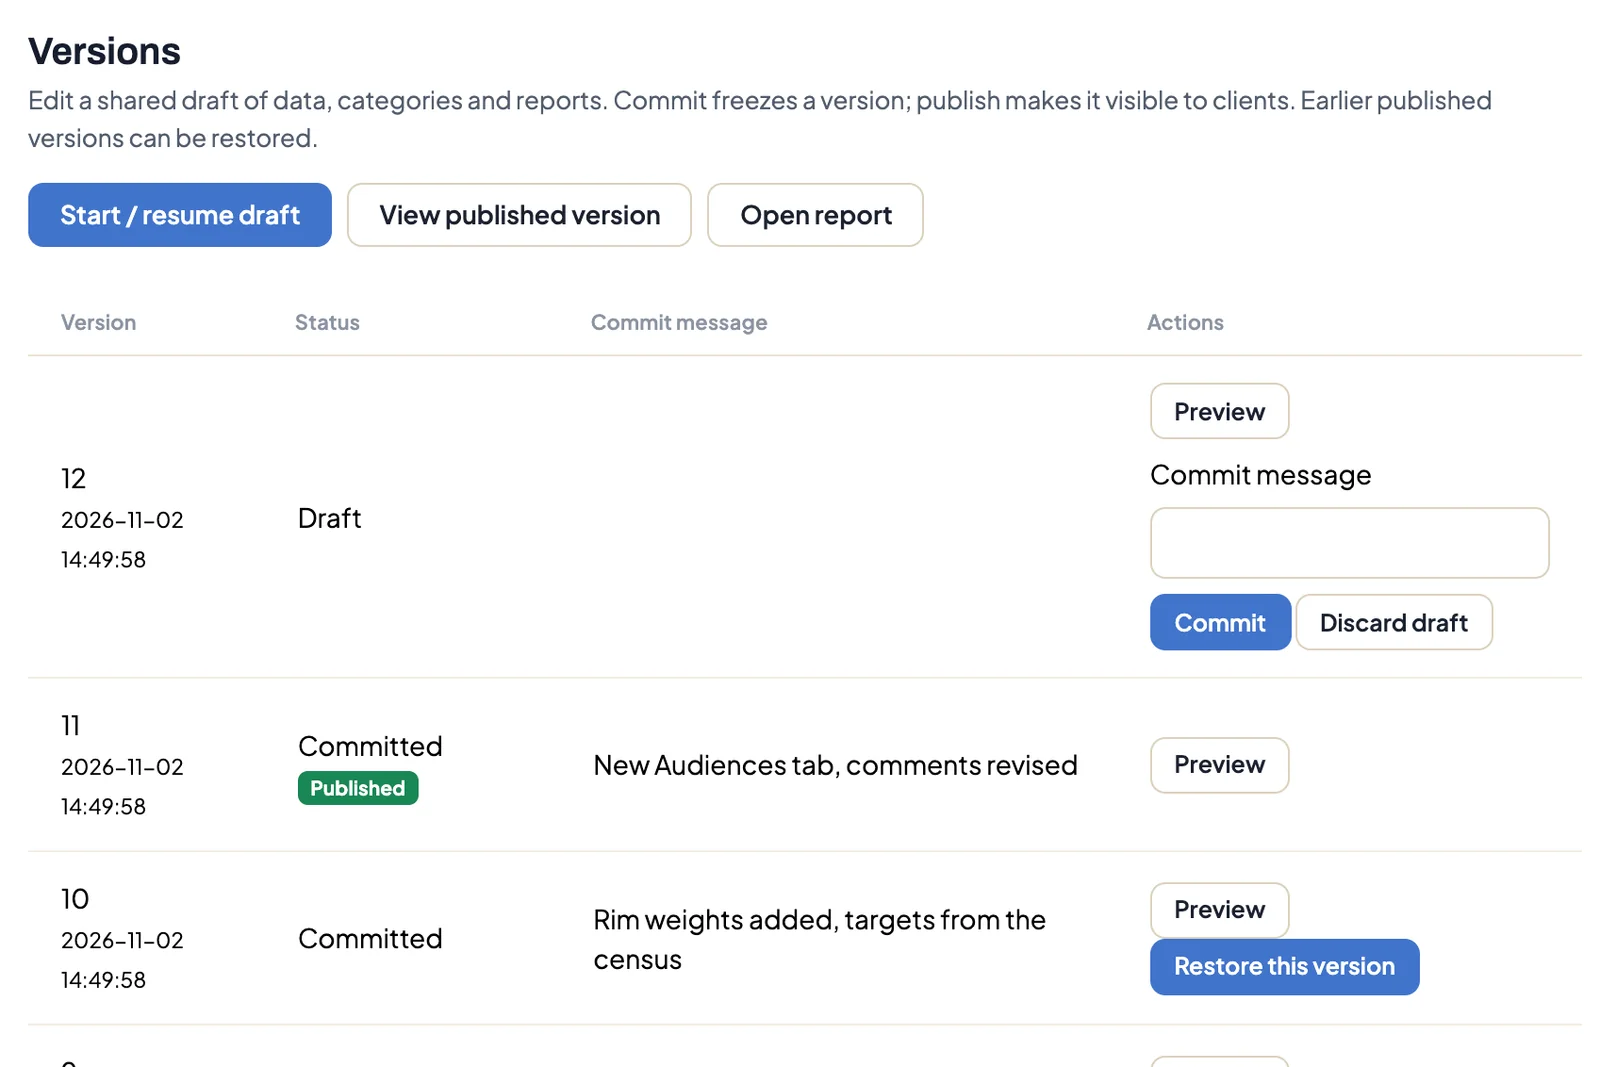
Version 11 is published, version 12 is still a draft. Older versions can be restored (demo data). 🔐 Single sign-on for members: Admin → Integrations → Single sign-on connects a SAML 2.0 or OpenID Connect provider such as Okta or Microsoft Entra ID. Members get an account on their first sign-in, and their membership tier decides which dashboards they see. More on single sign-on.
🤖 The AI uses the analysis engine: Ask your data and the dashboard AI chat now run DataLion's own methods: significance tests, key-driver analysis, factor analysis, distribution statistics, NPS and weighting information. The numbers come from the same calculation as your charts, with your access, filter and minimum-case rules applied. More on Ask your data.
🧮 Build custom variables where you work: In the chart menu, Edit chart data… → Save as variable creates a new variable. You can edit it later, and it survives codebook regeneration. Admins decide under Admin → Projects → Settings → Charts whether project editors may create custom variables.
📈 Improvements
🎨 Surveys that look like your brand: Survey → Settings → Design → Create your own design adds a header bar that can pipe in URL parameters such as a participant number, a footer with your own links, card and button shapes, content width, font size and your own webfont. Date questions can show an inline calendar and limit which days can be picked. More on survey design.
🏷️ Filters you can see: A filter chosen on one tab now shows up as a removable chip on tabs that don't have that dropdown. The new dropdown scope Tabs with this filter carries a selection only to tabs that use the same question.
💬 Notes on a single chart: Team notes now live in the dashboard navbar. You can attach a note to one chart, and a count appears next to its title.
🔗 Link to another tab: A Link to tab button in the header, footer and textbox editors lists the tabs you may open. No HTML needed, and the links keep working after a bundle import.
📤 Better exports: Excel writes the full question text under each chart and carries your project's name instead of ours. PowerPoint can use the dashboard's chart colours (Admin → Projects → Settings → Exports → PowerPoint), timelines match the dashboard, and table rows size to their content. PowerPoint exports of whole reports finish about a quarter faster, and PDF exports count progress chart by chart. A new switch under Chart settings → Advanced labels only the first series in grouped charts, such as the current wave.
⚡ Faster crosstabs: Charts with several breaks get every column and case count from a single pass over the data.
🧭 Radar, wind rose and drag and drop: Radar and wind rose charts are now drawn by DataLion's own chart library, with cleaner labels, a shared tooltip and keyboard and screen reader support. Moving charts, sorting codebook categories and dragging questions onto a dashboard work with mouse, pen and touch, and Escape cancels.
🛠️ Calmer admin pages: Every project settings page saves through the same save bar, with discard and Cmd/Ctrl+S. Rarely used options sit under Expert settings, and the project list and report editor are more compact. Admin → Projects → ⋯ → Import bundle into this project refreshes a project's content and data from a bundle while keeping its address, user rights and share links.
🧪 Synthetic panels (experimental): Admin → Synthetic panels lets you try out a questionnaire on fictional respondents first. Their answers stay strictly apart from real responses.
📱 Coming soon: DataLion for iPhone and iPad
Our app for report readers is in beta. It shows the reports you can open on the web, with native charts, filters, significance markers and KPI widgets for the home and lock screen. Everything the app needs on the server already ships in this release. If you'd like to test the app before it reaches the App Store, ask your contact at DataLion.
🔐 Security
Viewers whose access profile hides the navigation now reach only the variables of their own reports, across charts, exports, filters, search and AI. Google and Microsoft sign-ins always complete your account and MFA checks before a session starts. Responses submitted at the same moment can no longer be saved twice.
🐛 Important Bug Fixes
- Statistics: Means, bases and distributions of numeric questions count answers of zero again. Stepwise regression selects predictors again, and models that don't converge report an error instead of plausible-looking numbers.
- Weighting: Cell weights from weighting scripts are no longer inverted. Affected projects get correct weights on their next recalculation.
- Exports: Large dashboards export to PowerPoint, Excel and Google Slides again. A failed chart leaves exactly one error slide.
- Charts: Custom labels stay with their chart, moved charts keep their position and new colour schemes apply right away. Cumulative timelines, CAGR forecasts through zero and timelines without a default interval draw again.
- Codebook: Merged answers filter correctly, and codebook changes update dashboards without a manual cache reset.
- Bundles and reports: Bundle imports keep the start tab and internal links and handle wide tables. HTML start pages show their styling again, and the report editor confirms every save.
Enjoy DataLion 2026.3.200. If you try rim weighting on one of your studies, we'd like to hear how it went.