
Connect Power BI and Microsoft Fabric (BI feed)
The BI feed publishes a project’s results as an OData feed. Power BI and Microsoft Fabric load weighted percentages, bases, means and significance marks from it, all calculated by DataLion beforehand. This guide covers the setup in DataLion, the connection from Power BI Desktop or Fabric, and your first report. For what the feed contains and where its limits are, see Power BI integration.
Requirements
- DataLion release 2026.2.197 or later.
- An administrator account. Only administrators can set up and read the feed, see Roles.
- Power BI Desktop (Windows only) or a Microsoft Fabric workspace.
Set up the BI feed in the project
The feed starts switched off in every project. Open the project under Admin → Projects and go to the BI feed tab in its settings.
- Switch on Enable BI feed.
- Under Questions, choose All aggregatable questions or Selected questions. With the second option, select the questions in the list. Open-text answers, MaxDiff, conjoint and advanced-statistics outputs can’t be aggregated, so they aren’t offered.
- Under Breakdowns, select the variables you want to compare by in Power BI, such as gender or age group.
- Under Wave × breakdown combinations, select the breakdowns you also need per wave. Without this, DataLion calculates a breakdown across all waves combined only. Every variable you pick here must also be selected under Breakdowns.
- Check Wave source, Weighting, the means option and Wave significance. The wave source decides whether waves come from the project’s waves or from a question. Weighting follows the project’s weighting by default, and the alpha for the wave test is 0.05.
- Under Maximum materialized cells, an estimate shows how many cells your selection produces. The default budget is two million. If the estimate is higher, the settings can’t be saved. Select fewer questions or breakdowns, or raise the budget.
- Click Save. DataLion then builds the feed in the background.
Progress appears below under Materialization status. The state moves from pending through running to ready, and from then on the first version is available. If it shows failed, Last error gives the reason. You can start a new build at any time with Rebuild now at the top of the page.
Create a token for Power BI
Power BI signs in with an API token. The quickest way to create one is from the BI feed page.
- In the OData service URL box, click Create a Power BI API token. The API access page opens with the purpose “Power BI” and a token name that includes the project. You can also reach the page through Admin → Integrations → API access.
- Under Expiry, choose 30, 90 or 365 days, or Never. The default is 90 days.
- Click Create API token and copy the token with Copy. DataLion shows it only this once. Keep it as safe as a password.
- On the BI feed page, copy the OData service URL. It has the form
https://<your DataLion address>/api/v1/odata/projects/<project ID>.
The “Power BI” purpose allows reading only. Under Your API tokens you can see when a token was last used and when it expires, and Revoke it. When a token expires, the next refresh in Power BI fails. Create a new one and enter it in Power BI.
Connect from Power BI Desktop
- Choose Home → Get data → OData feed. If it isn’t in the list, you’ll find it under More… in the Other category.
- Paste the OData service URL and confirm with OK.
- In the sign-in dialog, choose Basic. Enter any user name and use the token as the password.
- In the navigator, select the five tables
Breaks,Meta,Questions,ResultsandWaves, then click Load.
Continue with the data model. When you later publish the report to the Power BI service, open the semantic model’s settings, go to Data source credentials and enter Basic with a user name and the token once more. After that you can set up a scheduled refresh.
Connect from Microsoft Fabric
In Fabric, a Dataflow Gen2 loads the feed into a lakehouse. You then build the semantic model and the report on that lakehouse.
- In your workspace, create a Dataflow Gen2 through New item.
- Choose Get data → OData and paste the OData service URL. For the authentication kind, choose Basic, with any user name and the token as the password.
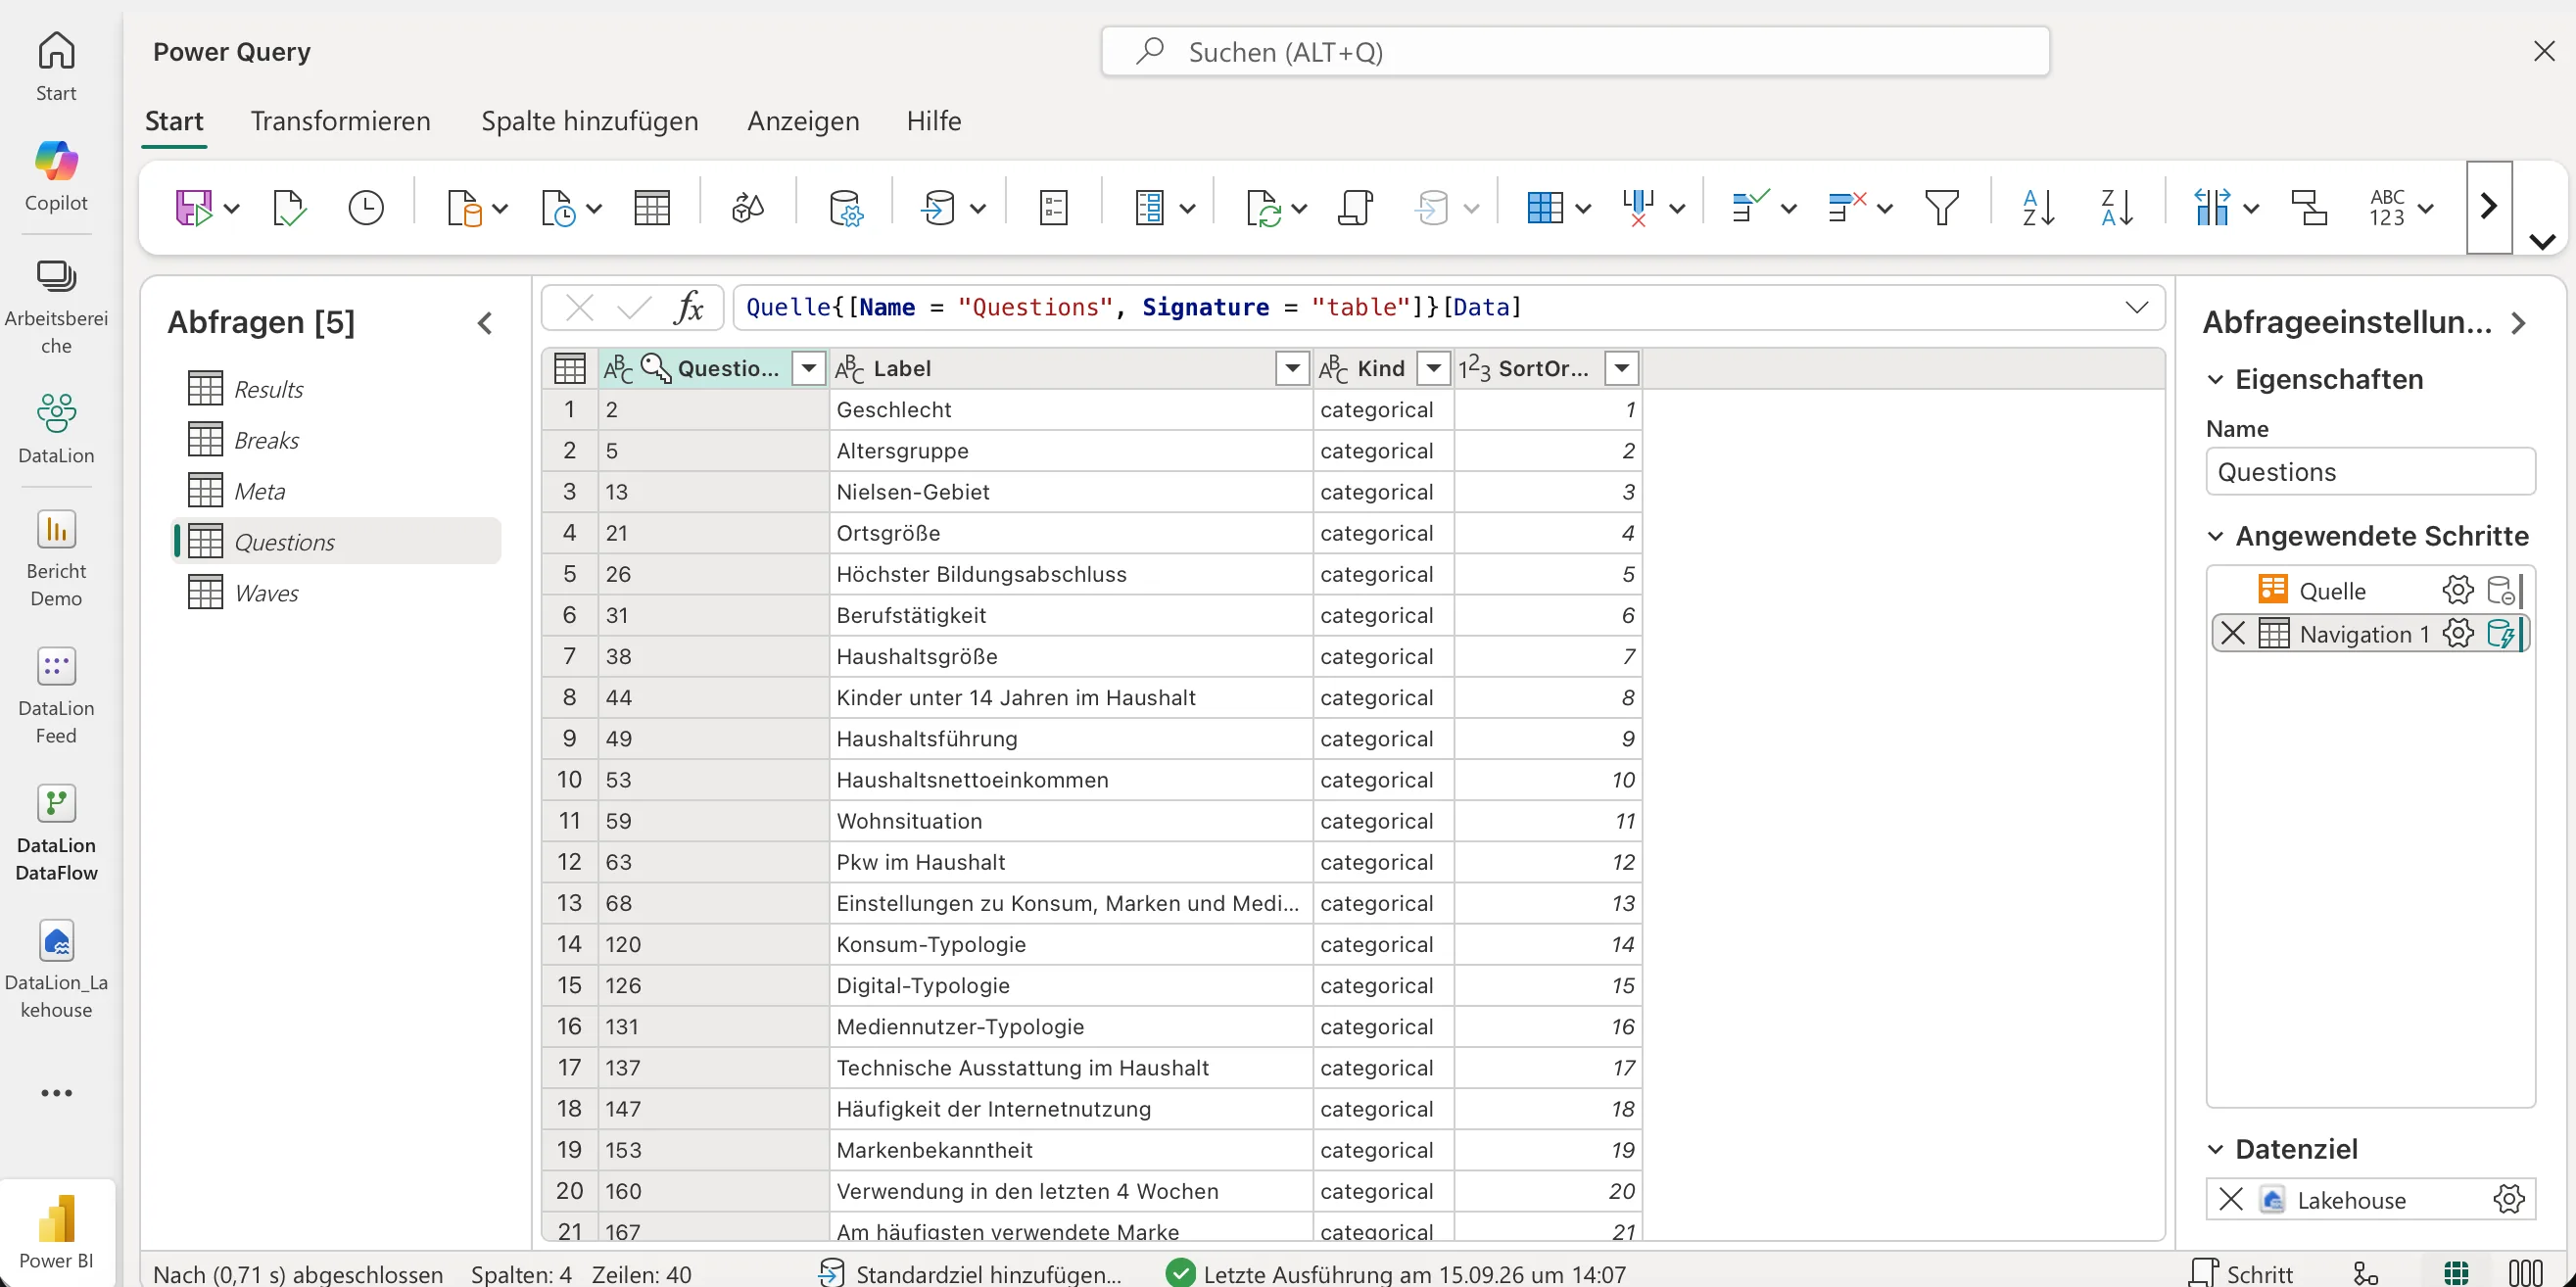
- In the navigator, select the five tables and click Create. Each table becomes its own query.
- Give each query a data destination: your lakehouse, New table, the query name as table name, and Replace as the update method. With Append, every refresh would add all rows again, because the feed is always loaded in full.
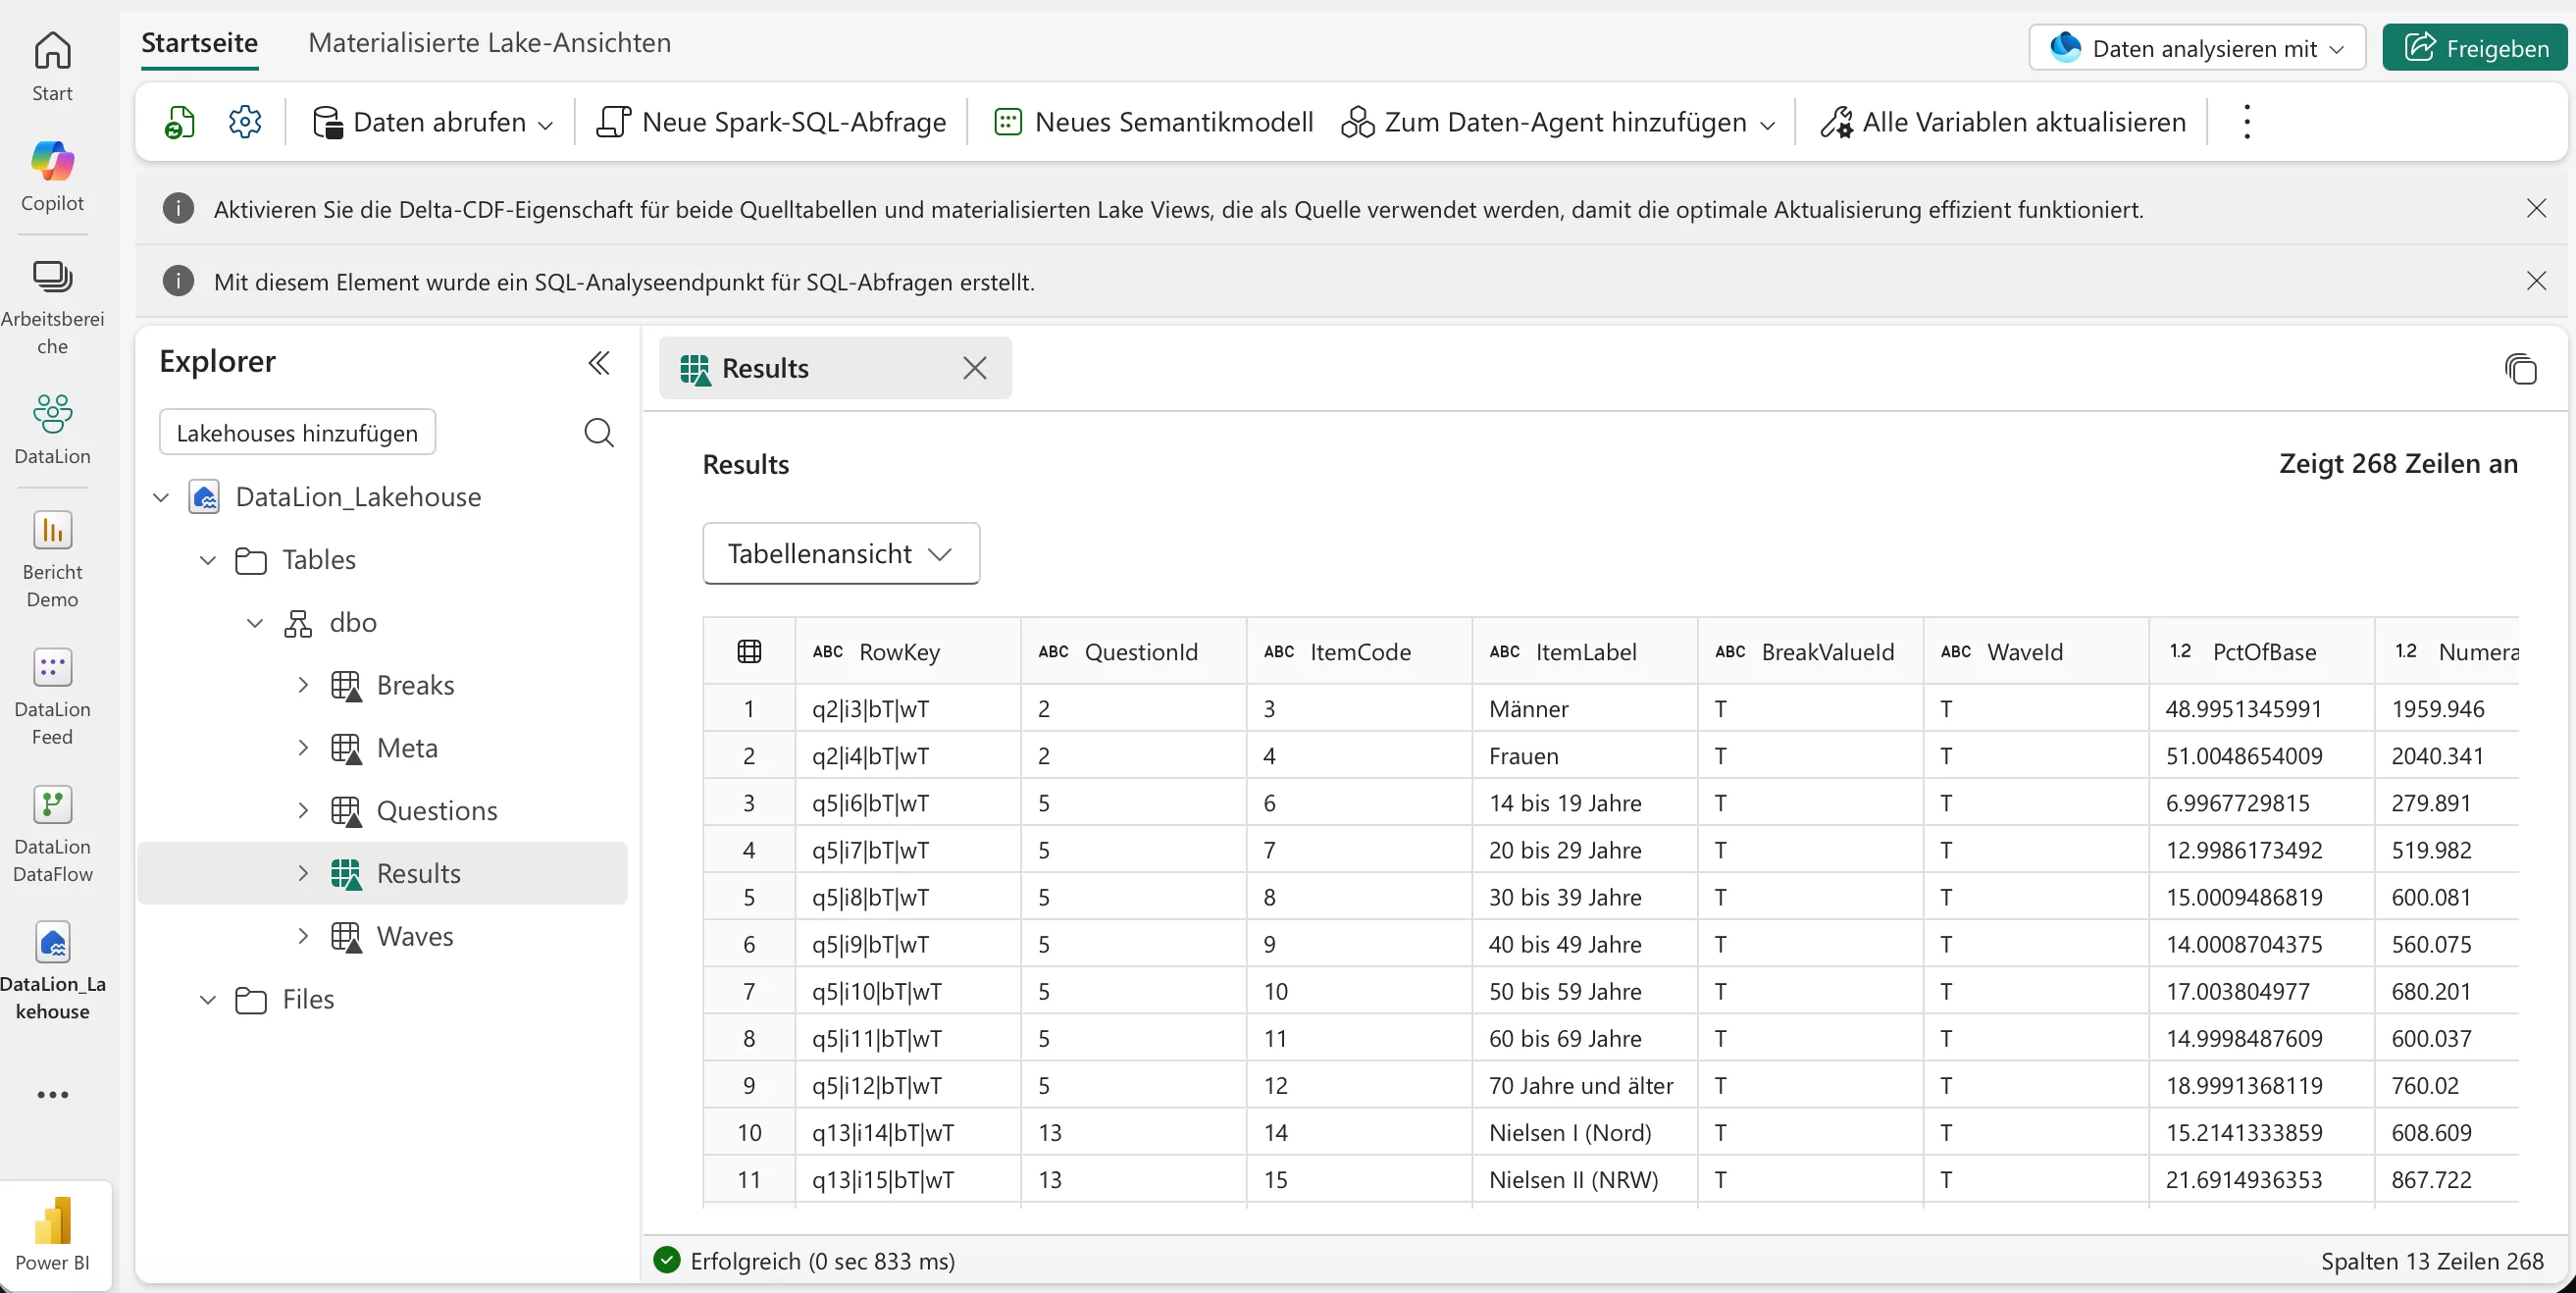
- Save and run the dataflow. The five tables then appear in the lakehouse under Tables.
- In the lakehouse, click New semantic model, select the five tables and confirm.
Relate the tables
The feed is a star schema. Results holds the numbers, and the other tables supply labels and sort order.
Results: one row per question, answer, breakdown value and wave, withPctOfBase(percentage of base),NumeratorWeighted,BaseWeighted,BaseUnweighted,Mean,SigVsPrevandSigMark(▲ or ▼)Questions:QuestionId,Label,KindandSortOrderBreaks:BreakValueId,BreakVarId,BreakVarLabel,ValueLabelandSortOrderWaves:WaveId,Label,StartDate,EndDateandSortOrderMeta: time of the last build (MaterializedAt) and the cell count
In the model view, relate Questions[QuestionId], Breaks[BreakValueId] and Waves[WaveId] to the column of the same name in Results, each as a one-to-many relationship with the “one” side on the small table. Meta stays unrelated.
Breakdowns and waves each have a total member with the ID T. Rows with BreakValueId = T and WaveId = T cover the whole sample across all waves.
Build your first report
PctOfBase is a finished percentage. Summed across several rows, it stops meaning anything. Create a measure in Results instead:
Share = DIVIDE(SUM(Results[NumeratorWeighted]), SUM(Results[BaseWeighted]))Format it as a percentage. The measure stays correct when a visual combines several rows. If the formula bar rejects the commas, separate the arguments with semicolons.
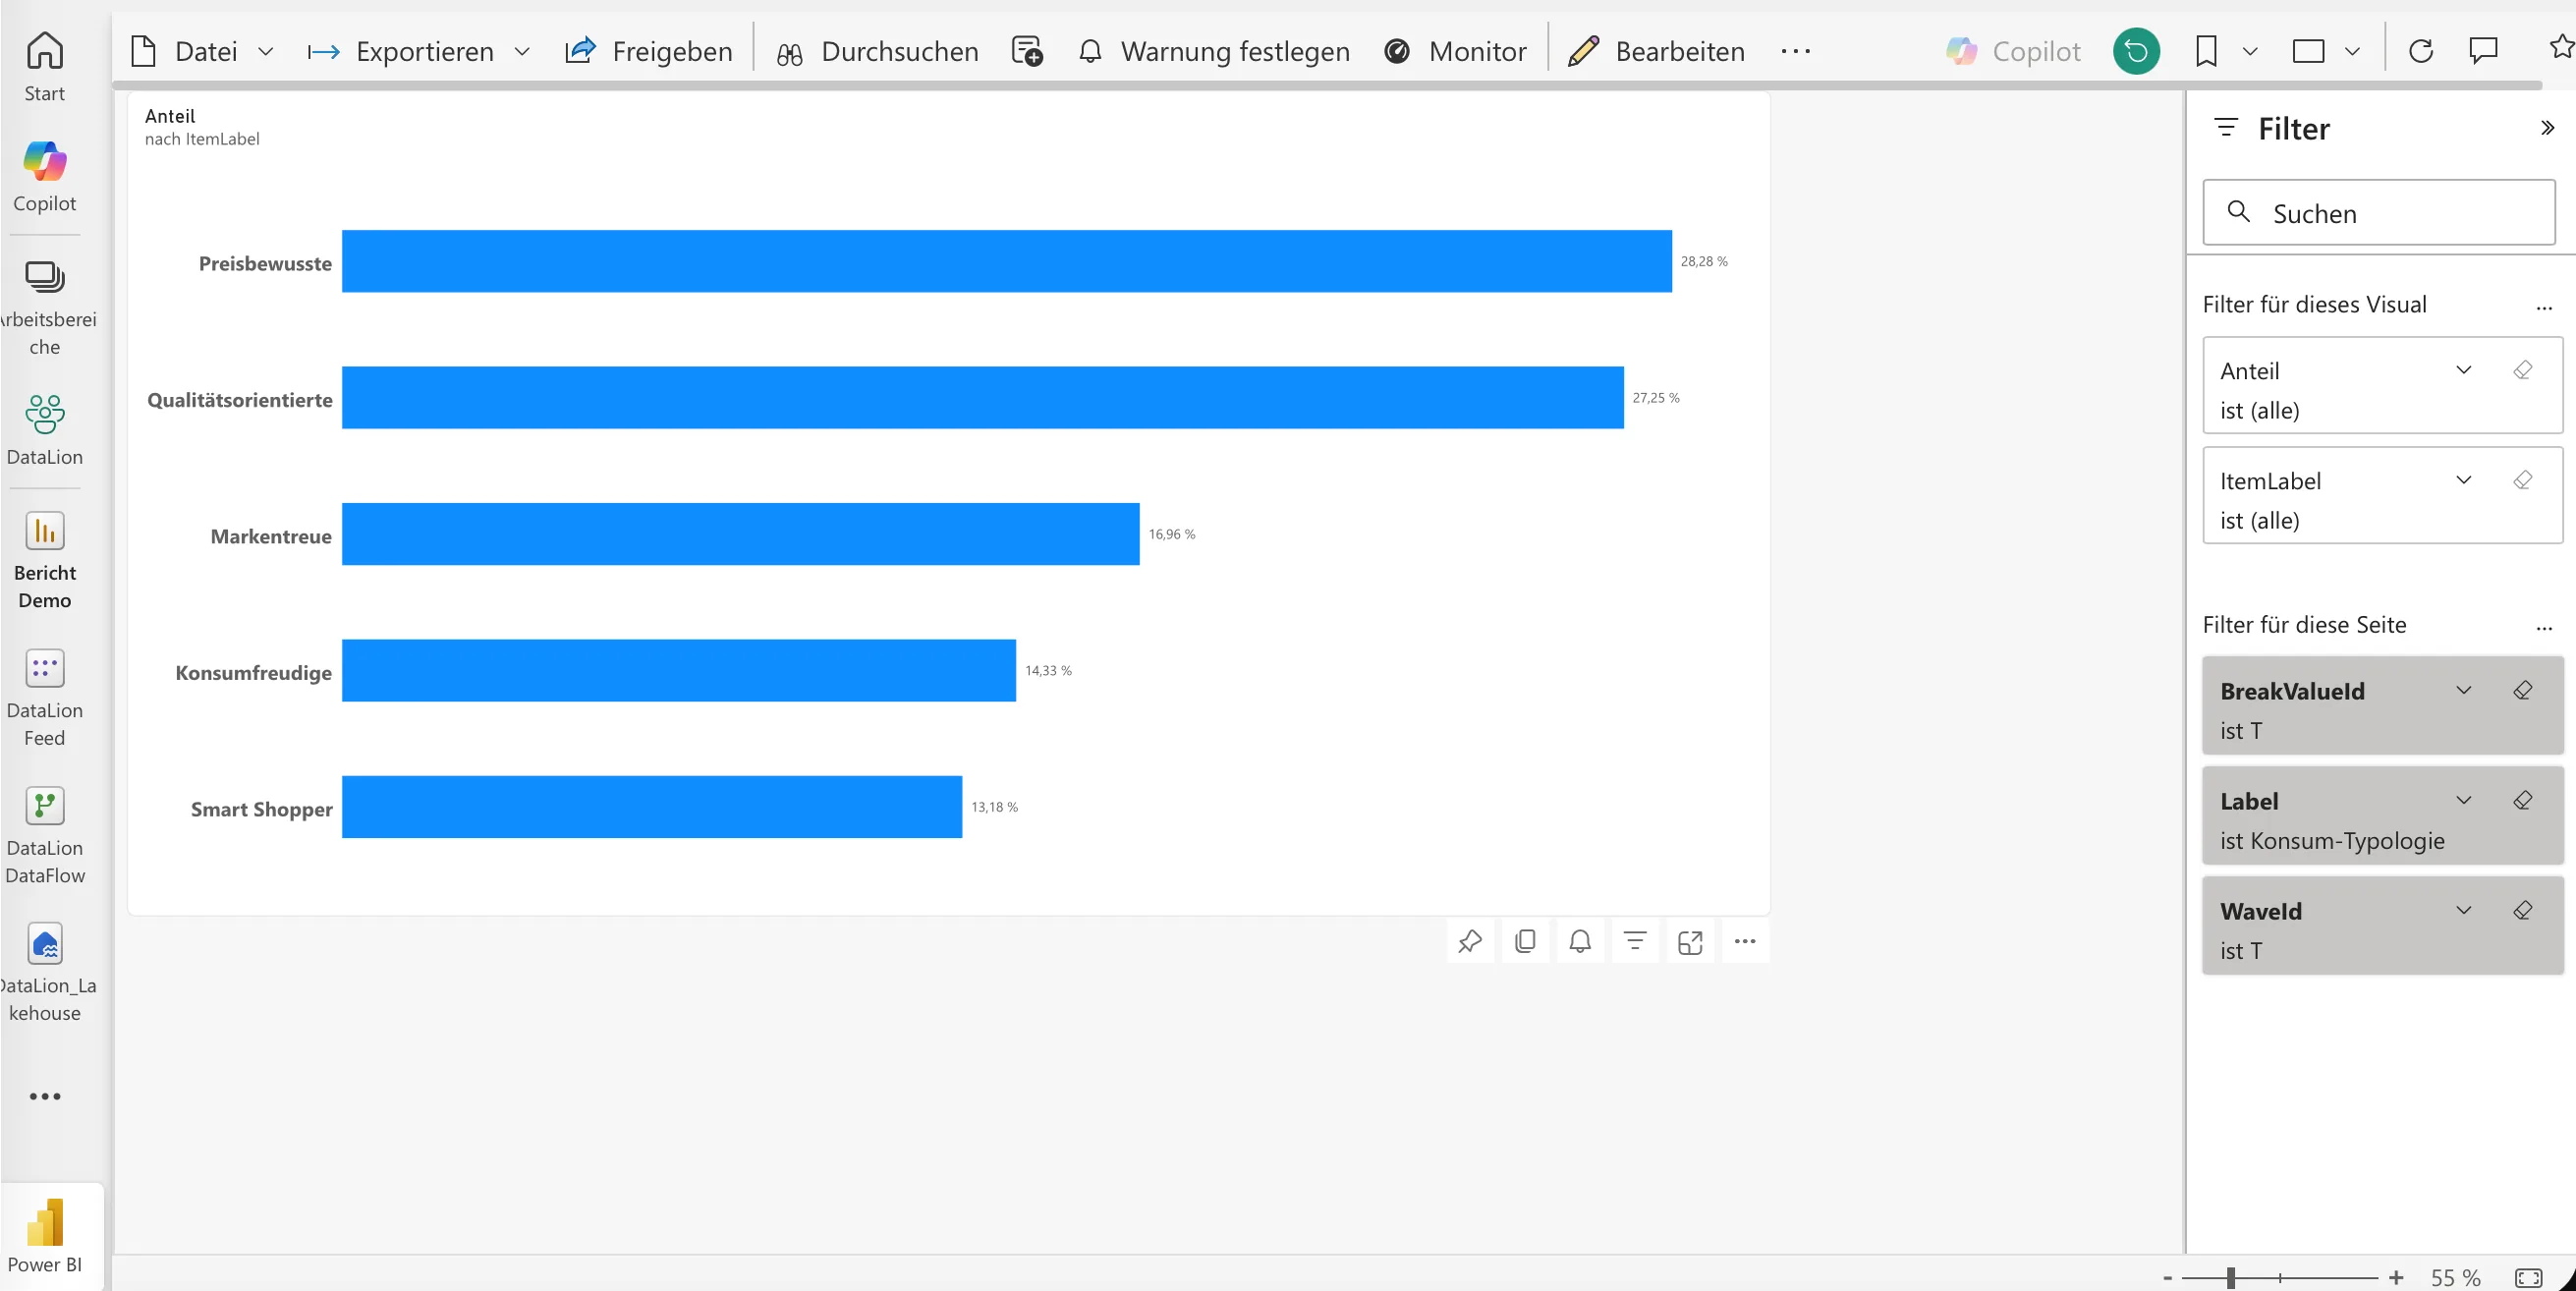
A bar chart for one question works like this:
- Add a Clustered bar chart with
Results[ItemLabel]on the Y-axis andShareon the X-axis. - In the filter pane, set three page filters:
Questions[Label]to your question,Results[BreakValueId]toTandResults[WaveId]toT. Without the twoTfilters, Power BI adds the total rows and the rows of every breakdown together. - Sort the axis by
Shareand switch on data labels.
To compare by breakdown, replace the filter on BreakValueId with a filter on Breaks[BreakVarLabel], for example “Gender”, and drag Breaks[ValueLabel] into the legend. To compare waves, keep BreakValueId on T, set the WaveId filter to every wave except T, and put Waves[Label] on the axis. To get the waves in the right order, sort Waves[Label] by the SortOrder column. If wave significance is switched on, SigMark in a table next to the share shows where a value changed significantly against the previous wave.
In table visuals, set BaseWeighted and BaseUnweighted to Maximum instead of Sum and switch off the totals row. The feed doesn’t suppress small bases. A visual filter on BaseUnweighted, for example 30 or more, handles that in Power BI.
Refresh
DataLion rebuilds the feed after each successful data import, after changes to the codebook or the waves, and when you save the feed settings. On top of that, every enabled feed is rebuilt each night at 2 a.m. German time. If a build fails, the last complete version stays available.
Power BI and Fabric fetch the data on their own schedule. Set the scheduled refresh to a time after the nightly build, such as early morning. The time of DataLion’s last build is in Meta[MaterializedAt]. Shown as a card in the report, it tells every reader how current the figures are.
The feed doesn’t evaluate filter queries. Power BI therefore loads every row on each refresh, in pages of 50,000, and Power BI’s incremental refresh doesn’t work with the feed.
Troubleshooting
- Power BI reports invalid credentials. Check whether the token has expired or been revoked, whether it belongs to an administrator account, and whether the sign-in is set to Basic.
- A question is missing. Select it in the BI feed settings, save, wait for the state
ready, then refresh Power BI. - The percentages are far too high. Usually the filters
BreakValueId = TandWaveId = Tare missing, or a visual sumsPctOfBaseinstead of using the measure. - Fabric shows the
Breakstable instead ofResults. The query’s navigation step then readsSource{0}[Data]and picks the first table in the feed. Change it toSource{[Name="Results"]}[Data]. - The Fabric semantic model says source tables don’t exist or access was denied. The lakehouse’s SQL analytics endpoint doesn’t know the new tables yet. Open it, click Refresh, then refresh the model.
- Readers should see only part of the data. Access profiles don’t apply to the feed, which contains every selected result. Restrict access in Power BI instead, for example with row-level security.