
Export & integrations
Survey results in Power BI, already weighted
The BI feed publishes a project’s results as an OData feed. Power BI loads percentages, bases and significance marks that DataLion has already calculated, so you don’t rebuild weighting or tests in DAX.
Available since release 2026.2.197. The feed starts switched off in every project until an administrator enables it.
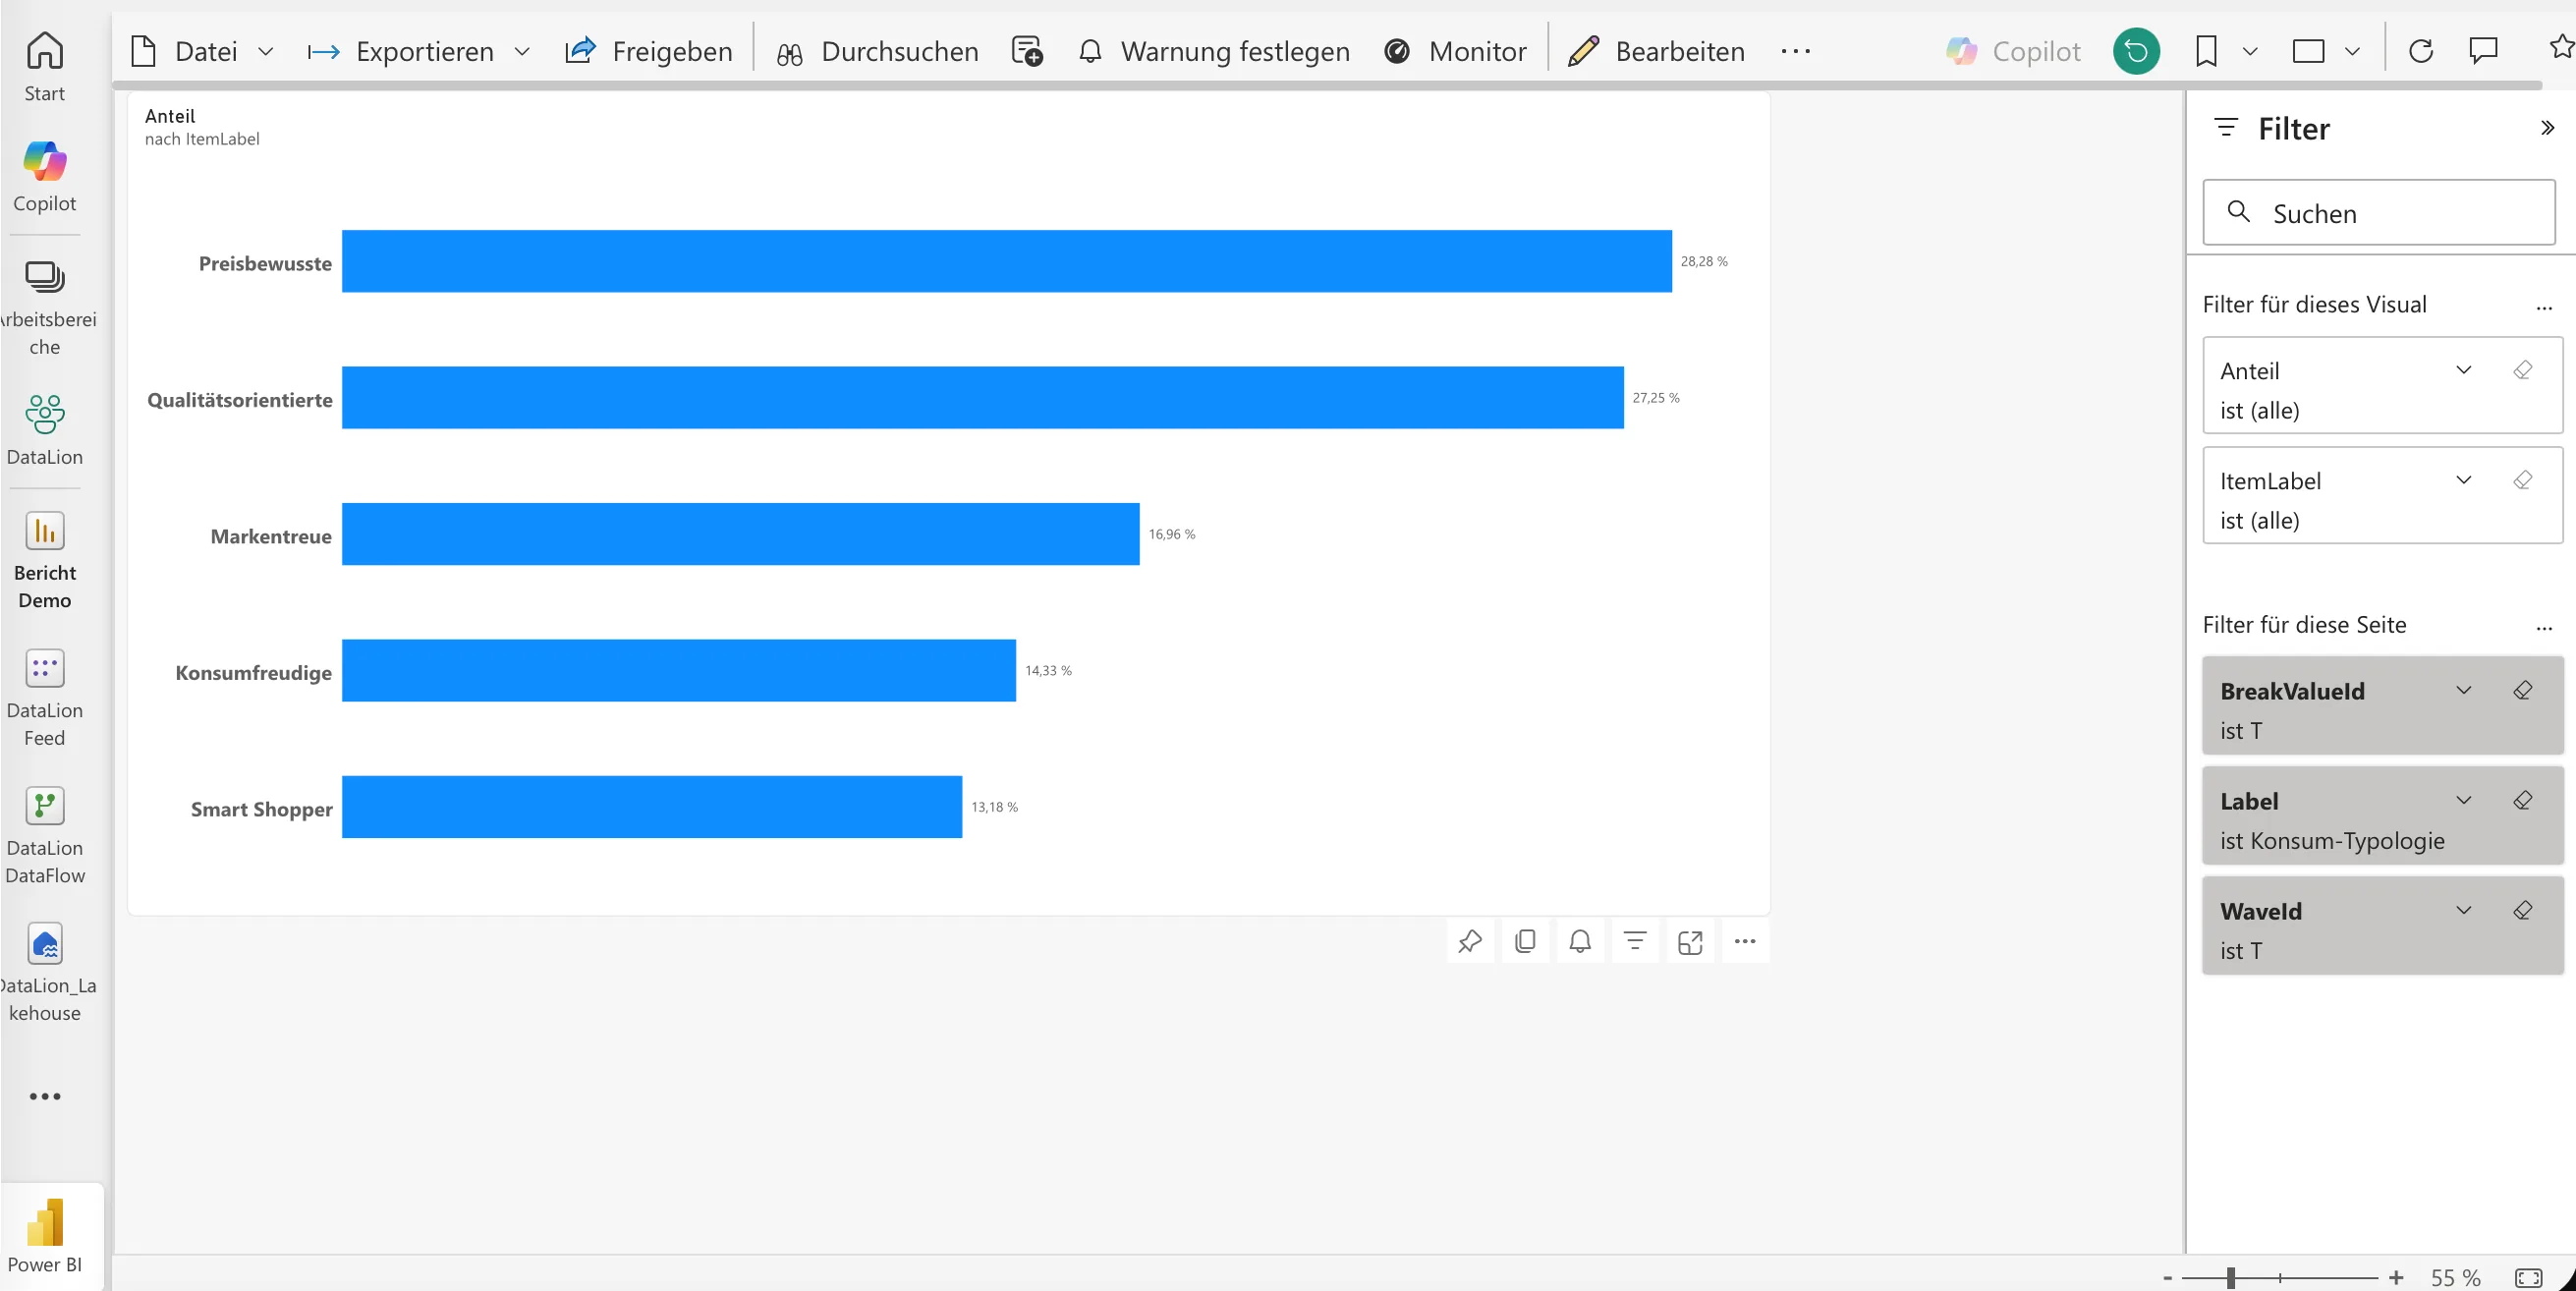
With the BI feed, Power BI loads the results of a DataLion project over OData: weighted percentages and bases, means and wave-on-wave significance marks, plus the labels for questions, breakdowns and waves. DataLion applies weighting and runs the tests before Power BI sees the numbers. The feed holds aggregates only, never individual responses. DataLion rebuilds it after each import and every night. Administrators set it up and read it.
- 🇩🇪 Made in Munich
- GDPR-compliant
- DPA included
- Hosted in Germany
- 🌐 Interface in EN, DE, FR, ES, IT & NL
Trusted by research institutes, brands & insights teams






- 50+ interactive chart types
- 20+ statistical methods
- SPSS · Excel · CSV import without data loss
- ISO 27001 certified data centers (Germany)
Five tables in a star schema
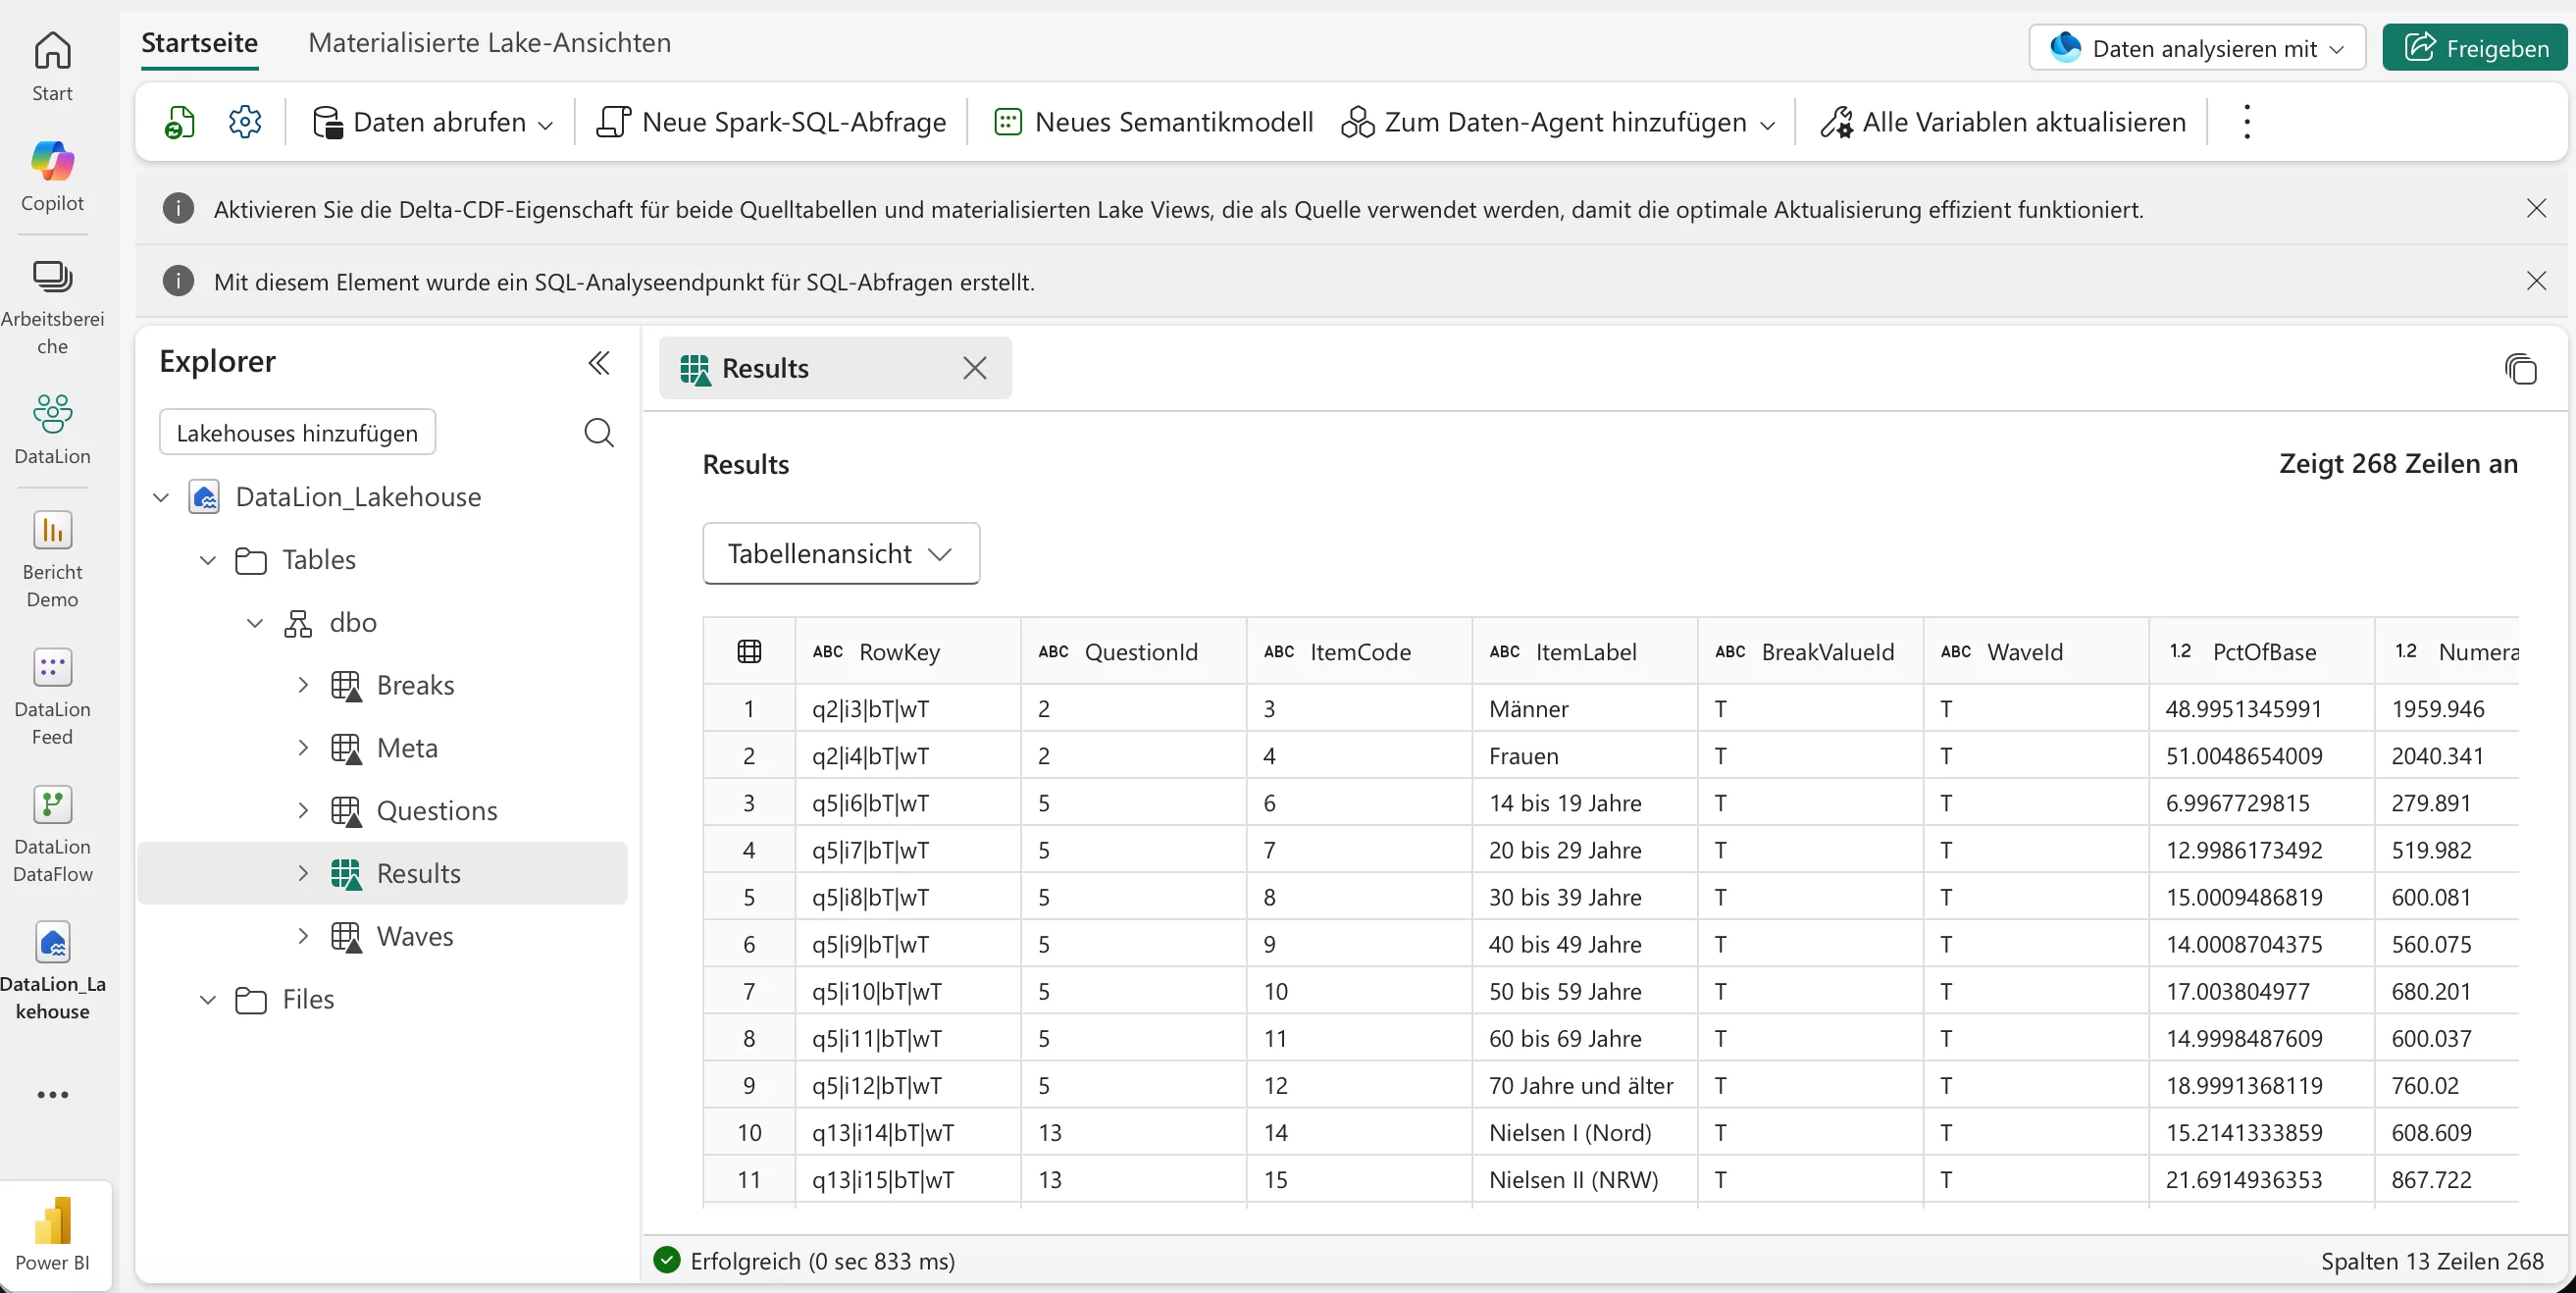
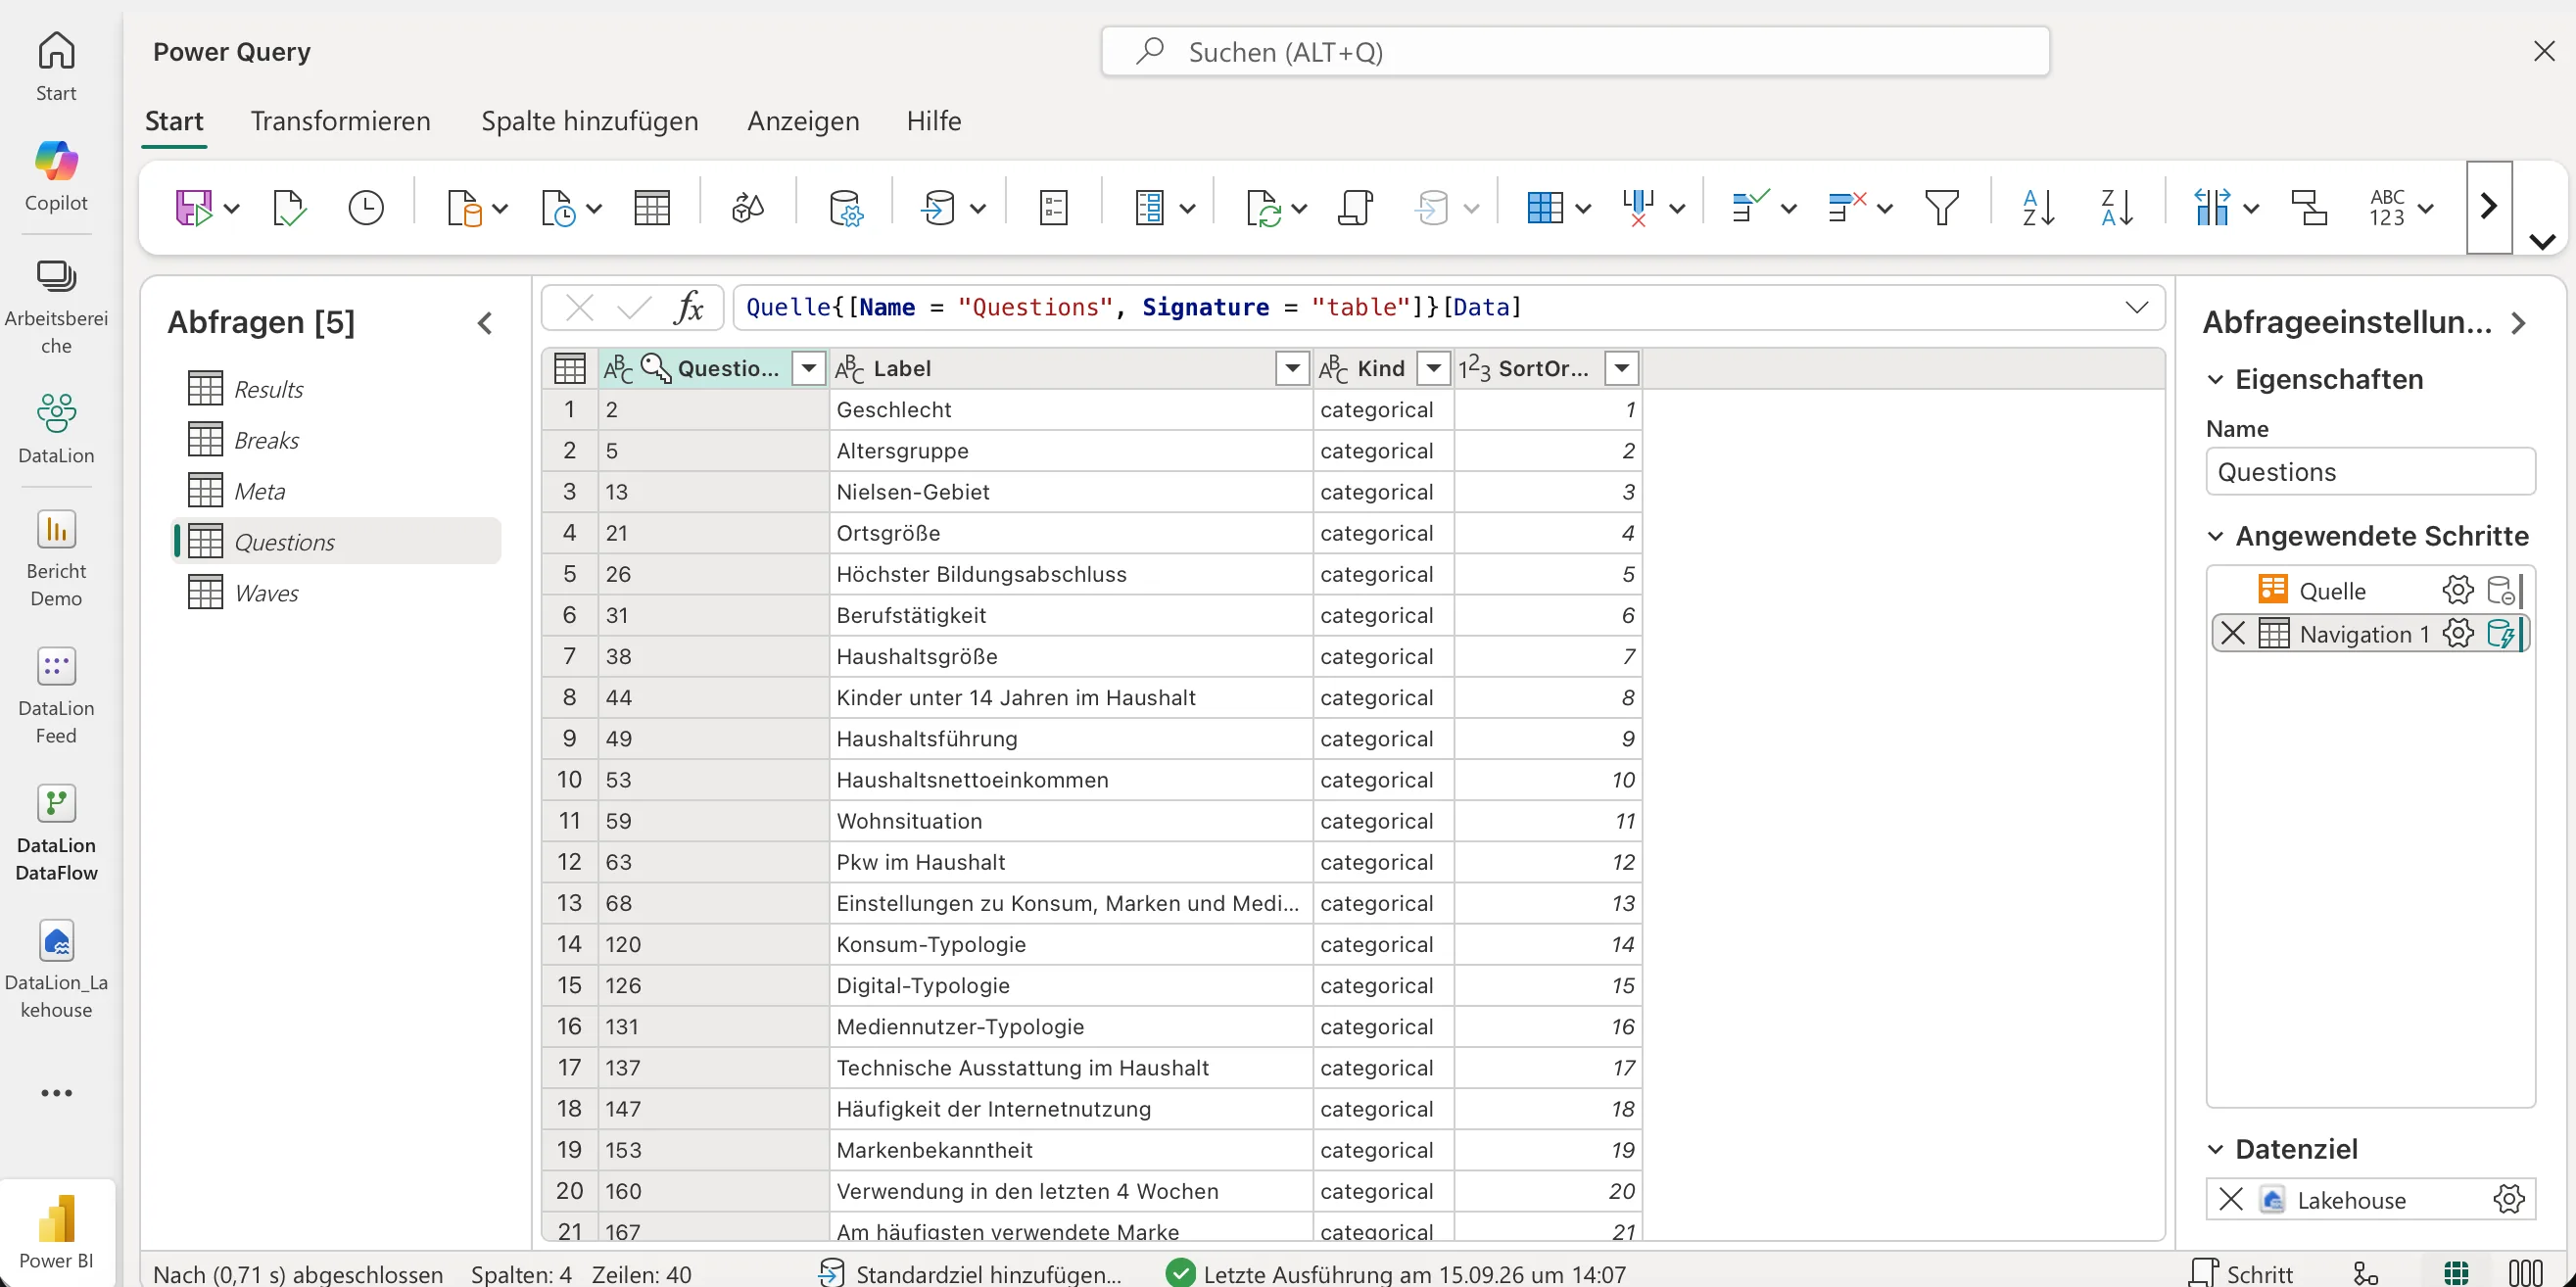
Each project gets its own feed with a fixed structure. The fact table Results holds one row per question, answer, breakdown value and wave. Questions, Breaks and Waves supply the labels and sort order, and Meta records when the feed was last built.
Every result row carries the weighted percentage of base (PctOfBase), the weighted numerator and base, the unweighted base, the mean for numeric questions, and the wave test result as a number and as an arrow (▲ or ▼). Breakdowns and waves each have a total member with the ID T, so you reach the full sample without building your own sums.
Individual respondents’ answers are not in the feed. Power BI reads only aggregates that DataLion has calculated and stored in advance.
Results: percentages, bases, means, significanceQuestions: question label, kind and orderBreaks: breakdown variables and their valuesWaves: waves with start and end datesMeta: build time and cell count
Weighting and the wave test arrive finished
Survey data follows rules a BI model doesn’t know about, weights and correct bases above all. With the BI feed, DataLion applies those rules before Power BI sees the numbers. In the feed settings you decide whether the project’s weighting applies, whether means are included and which alpha the wave test uses. The default is 5%.
One rule then applies in Power BI: PctOfBase is a finished percentage and must not be summed. For a percentage across several cells, divide the sum of NumeratorWeighted by the sum of BaseWeighted. Show the significance mark straight from SigMark.
- Weighting: as set in the project, always or never
- Wave test: two-sided z-test against the previous wave, adjustable alpha
- Means: optional, for numeric questions
How to connect Power BI to a project
You enable the feed per project. It stays off until an administrator switches it on and builds it for the first time.
Power BI signs in with an API token. In the sign-in dialog, choose Basic, enter any user name and use the token as the password. Treat the token like a password and revoke it under API access once you no longer need it.
- Under Admin → Projects → Settings → BI feed, select questions, breakdowns and waves. An estimate shows how many cells the selection produces.
- Enable the feed, save and choose Rebuild now. Once the status reads “ready”, the first version is available.
- Under Admin → Integrations → API access, create a token with the “Power BI” preset and copy it right away. DataLion shows it only once.
- Copy the OData service URL from the BI feed page.
- In Power BI, choose Get data → OData feed, paste the URL and load all five tables. Then relate
Questions,BreaksandWavesone-to-many toResults. - In Microsoft Fabric, a Dataflow Gen2 loads the feed through the OData connector and writes the five tables to a lakehouse. You then build the semantic model on that lakehouse.
The feed rebuilds after every import
DataLion rebuilds the feed whenever its basis changes: after a successful data import, after changes to the codebook or the waves, and when you save the feed settings. On top of that, every enabled feed is rebuilt each night. When a new wave arrives in a tracking study, DataLion calculates only that wave and keeps the rest.
Each build writes a new version that goes live only once it is complete, so Power BI never reads a half-built state. If a run fails, the last complete version stays available and the BI feed page shows the error.
How often Power BI fetches the data is set in its scheduled refresh. The Meta table holds the time of the last build. Show it in the report and every reader can see how current the figures are.
Access profiles and filters don’t apply in the feed
Only tokens belonging to an active administrator account can read the feed. Access profiles, which limit what someone sees in a dashboard, do not apply to it. The feed contains every result you selected for it. If different readers should see different data in Power BI, set that up in Power BI.
Of the OData query options, the feed evaluates only $count and ignores $filter and the rest. Power BI therefore loads every row on each refresh, in pages of 50,000. Power BI’s incremental refresh needs server-side filtering and does not work with the feed.
Open-text answers, MaxDiff, conjoint and advanced-statistics outputs are not in the feed. Small bases are not suppressed; use BaseUnweighted to hide them in Power BI. The wave test compares consecutive waves, not groups within one wave. Each project also has a cell budget, two million cells by default.
See DataLion with your own data
Start free with your own raw data. Or book a personal demo of the path to a finished dashboard.
What users say about DataLion
- via G2
The embedding function allows us to generate insights of our data for our audience and customers by far less than half of the usual time needed before.
Verified user · Leisure, Travel & Tourism - via G2
User-friendliness, especially for market research topics. Structured backend with many customization options.
Verified user · Market Research - via G2
The contacts at DataLion are very committed. If you have problems, you can count on help. DataLion reacts quickly to requests for new functions.
Robert Q. · Managing Director - via G2
Very professional company, attentive to the customer needs, provider of a great software and service.
Generoso M. · CRM Analyst, Automotive

We now work much more efficiently, giving us more time to take care of the derivations and insights from the data for the customers.
More on integration and analysis
Guides in the help center
Common questions about the Power BI integration
What data ends up in Power BI?
Who can read the feed?
How current are the figures in Power BI?
Does the feed support Power BI incremental refresh?
Can I use the feed in Excel too?
What happens if a rebuild fails?
Bring your study results into Power BI
Try DataLion free with a project of your own, or book a demo to see how the BI feed works with your Power BI report.