
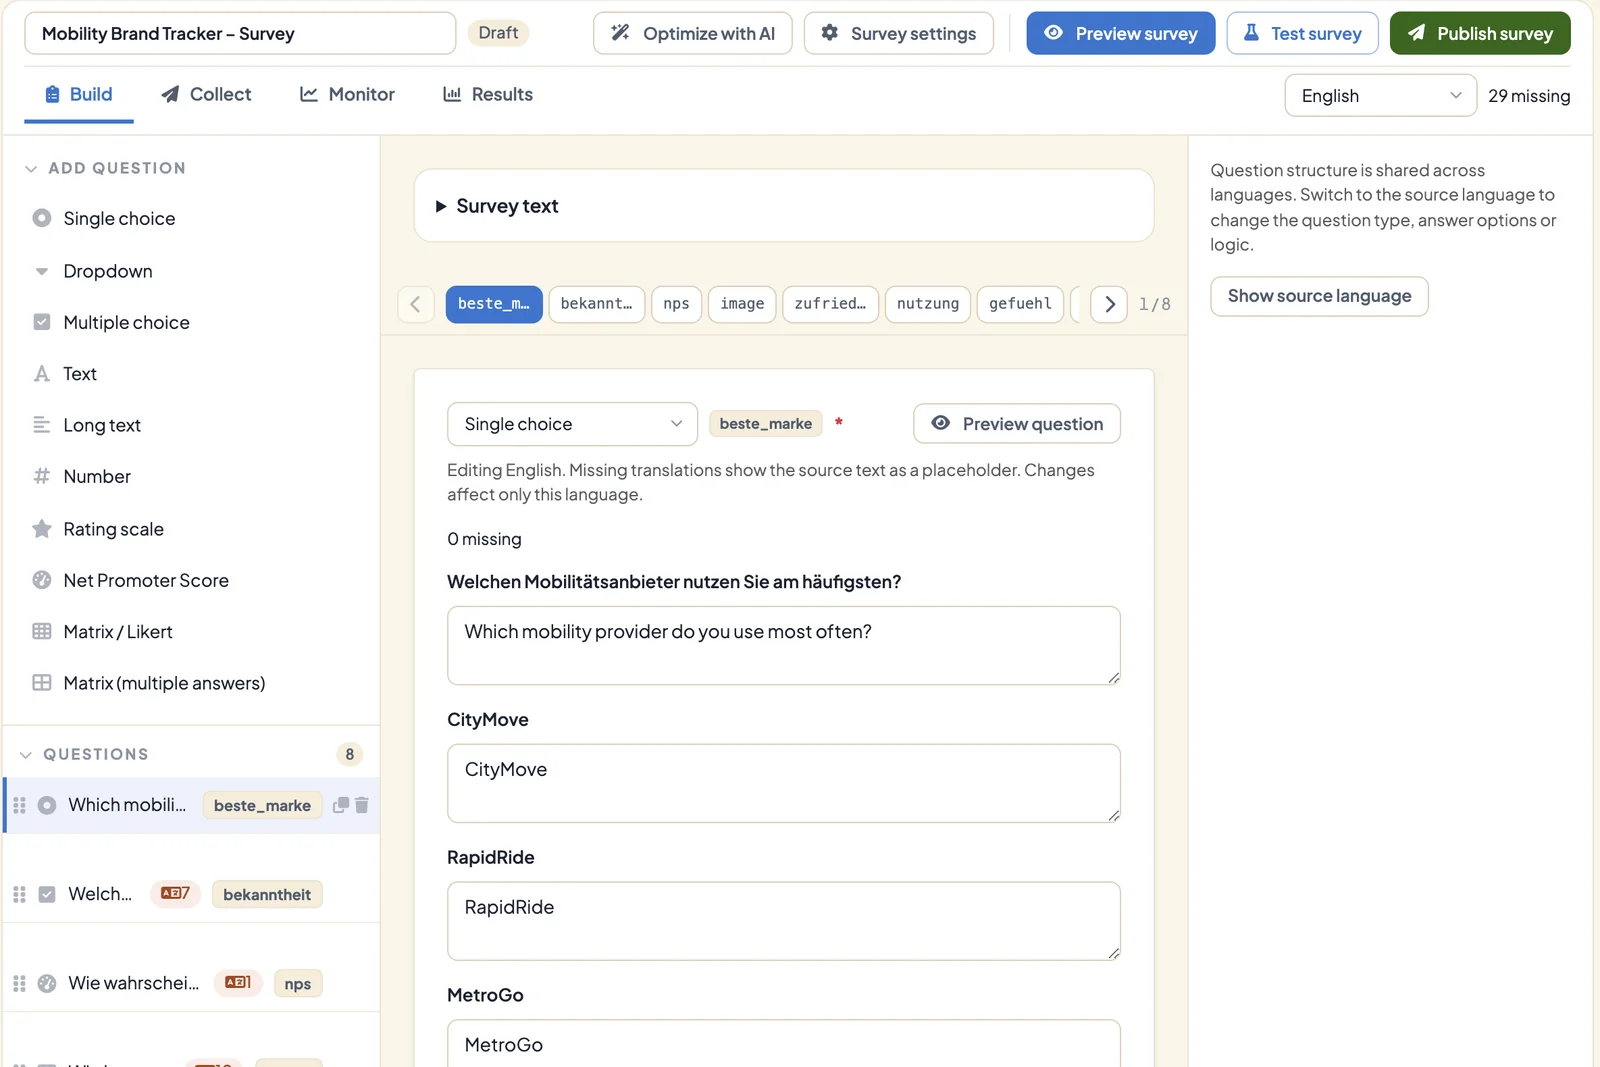
🚀 Highlights
One questionnaire in several languages: Under Survey settings → Languages, add languages to a survey, from 26 presets or with a custom language code. You translate questions, answer options, survey messages, and navigation right in the editor. The Questionnaire language switcher changes every question and both previews at once, and missing translations are marked and counted. All languages share the same answer codes and the same results dataset. DataLion stores the language of each response alongside the answers.
Respondents can switch language in the middle of a survey and keep their answers. The language they see first comes from the survey link, a saved response, or their browser, and right-to-left scripts are supported. For German, English, French, Dutch, Italian, and Spanish, DataLion ships the questionnaire's interface text already translated. For other languages you enter that text yourself, or it appears in English. Languages are fixed once the survey is published.
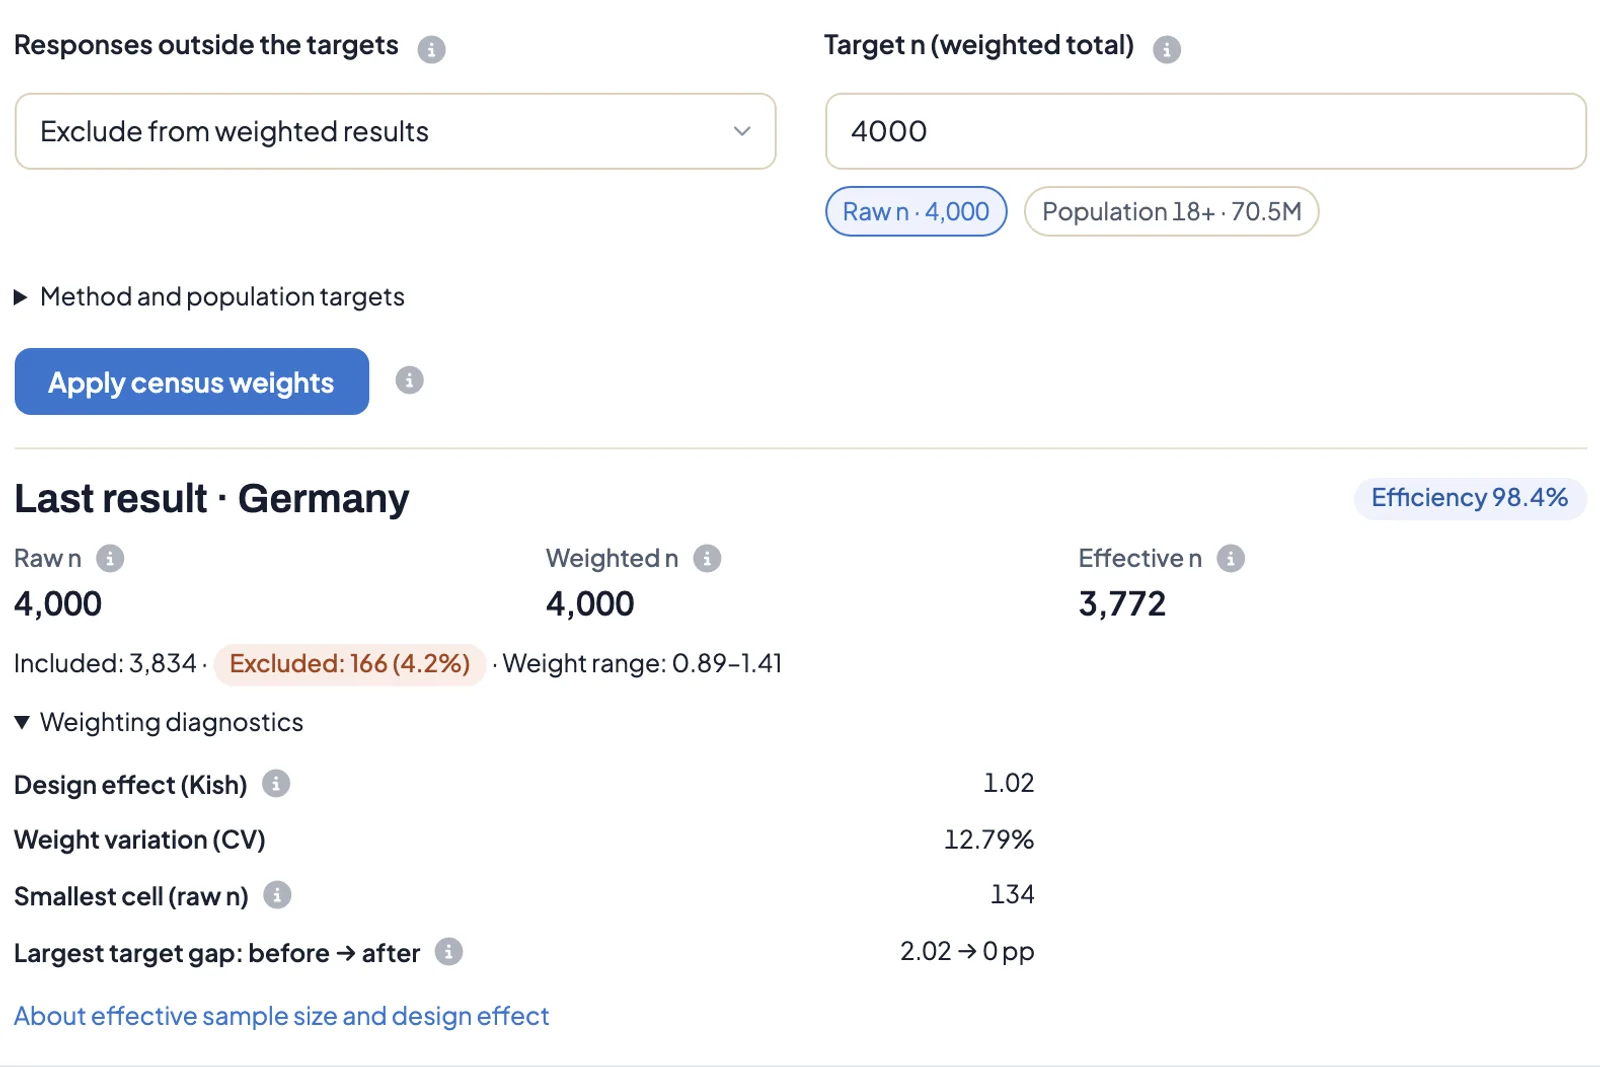
Census weighting for 34 countries: Under Admin → Projects → Data → Weights, you can weight a sample by age and gender to a country's population without typing targets or uploading a weight file. The built-in targets cover the EU27 plus Australia, Canada, New Zealand, Norway, Switzerland, the UK, and the US. They come from the United Nations World Population Prospects 2024: adult resident population in 2023, in six age bands by gender. Pick the country, map respondent ID, age, and gender, and choose the matching codes from your data in dropdowns.
The target n starts at the unweighted case count, and one click switches it to the adult population when you want to project results. After you apply the weights, you see raw, weighted, and effective n, the efficiency, and the weight range. Expandable diagnostics add the design effect and the gap to the targets before and after weighting. Responses outside the targets can be excluded, or you can stop the calculation for review.
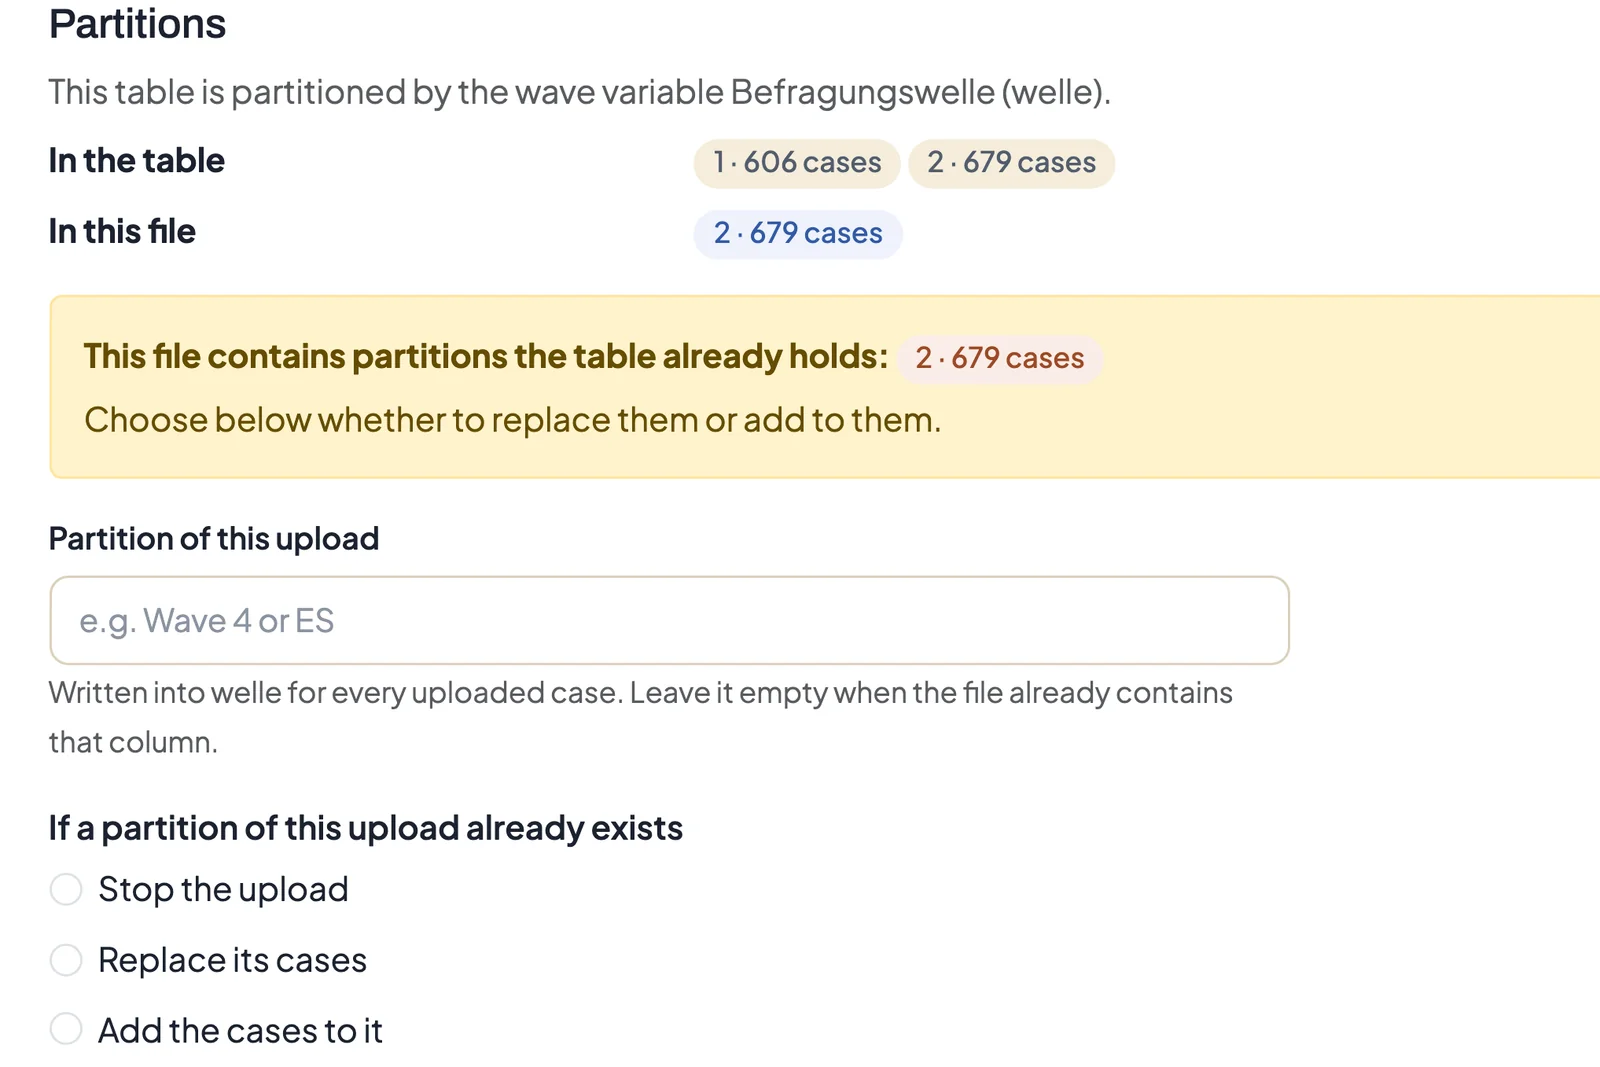
Upload new waves without doubling data: Uploads into a project's main table can be grouped into partitions, such as waves or countries. By default the wave variable is the partition key, so trackers need no setup. The upload preview lists the partitions in the table and in the file, each with its case count. If the file repeats a partition the table already holds, you can stop the upload, replace that partition's cases, or add to them. Until this release, uploading the same wave twice simply appended its rows a second time. When you replace a partition, DataLion imports into a copy of the table and switches over once the copy is complete.
With Update with release, new data lands in a draft first. Administrators check it with View draft in the dashboard while everyone else keeps seeing the current numbers. The data goes live when you click Release, and Restore previous version brings the old state back. In the upload preview, Exclude columns lets you untick what should stay out, such as serial numbers or timestamps. DataLion remembers that selection per data source. Later uploads add new questions and answer options to the codebook and leave existing questions, options, and IDs as they are. IBM Dimensions files (MDD and DDF) arrive with their question structure, including shared category lists, multiple choice, loops, and brand blocks.
Tables for wave comparisons and funnels: Table charts can be set up as wave comparisons. Bars can sit next to the value, the current wave is highlighted, and group rows appear as a bold label row or a separator line. The comparison column shows the difference from the previous column, either after every column or once at the end. It can also draw those differences as bars that grow from the middle. Green and red triangles mark significant differences from the previous column, in Excel and PowerPoint exports as well.
Show as funnel turns a stacked question into a funnel. Each stage adds up its own answer and every more engaged one, with conversion rates between the stages. If 90 percent know a brand and 70 percent have bought it, the conversion between those stages is 78 percent. You can rename column headers by double-clicking them, and tables with 20 rows or more get their own search field.
Ask your data knows the dashboard and exports to PowerPoint: On a dashboard tab, Ask your data knows the tab's charts in their order and resolves "the first chart" or "the last two" without searching the codebook. The AI recalculates each chart with its own settings and the active filters, so every number comes from DataLion. When you ask for it, it starts a PowerPoint export of the charts you chose. Each slide then carries a headline finding beside the chart, with two to four supporting points and their numbers and bases, styled in the project template and labeled as AI-generated. The same text goes into the speaker notes.
For regressions, Ask your data produces a full model report. It covers coefficients with classical and robust (HC3) standard errors, 95 percent intervals, screening for influential cases, and residual plots. Besides linear models it fits log, quadratic, and threshold models, plus Poisson and negative binomial models for counts, unweighted and on complete cases. No individual response rows are sent to the language model. Under Advanced statistics → Output → Regression diagnostics, DataLion also shows R², RMSE, the F-test, VIF, and tests of the model assumptions.
✨ What's New
🔌 AI clients connect over the web: DataLion serves the Model Context Protocol as a web endpoint. AI clients that support remote MCP with a token can work with projects, codebooks, and chart tables without a local install. The preset of the agent's API token decides which of the 34 tools it sees. Files move through one-time upload links, and every tool call is recorded in the admin log. For the time being the endpoint is open to administrators. More on the MCP integration.
🔑 A user API for selected people: Under Admin → Integrations → User API, individual non-admin users get their own read-only token for 30, 90, or 365 days. Per project, you decide whether report tables are available and whether raw data is withheld, filtered by access profile, or delivered in full. You can exclude single reports and columns, for example to keep personal data out. Access filters and minimum bases apply as they do in the report. Documentation for the API is on every instance at
/docs.🎨 A theme from your PowerPoint template: In Theme Studio, Import from PowerPoint takes a corporate template as .pptx or .potx. A review page shows what DataLion reads from it: accent colors in PowerPoint's chart-series order, a light or dark look, the title color, and fonts. Colors with too little contrast are flagged but left unchanged. If the deck contains charts, they also yield a chart style with legend, data labels, and bar width. Every value is read from the template, and no AI is involved. More on dashboard design.
📊 Combine charts: Combine with other charts… in the gear menu merges charts on a page into one grouped bar chart. Brands can sit side by side as groups, for instance, each with a bar for top of mind, unaided, and aided awareness. Charts that show several questions side by side can be pivoted so each brand gets its own panel. A shared legend then replaces the repeated labels.
↪️ Move charts to another tab: Move to tab… in the chart menu places a chart, with all its settings, at the end of another tab in the same report. New tabs can be created with Add tab to report right in the tab menu.
🩺 Project health: Under Admin → Projects → Health, DataLion checks a project's formulas, codebook rows, answer options, and data sources, and suggests the column you probably meant when one is missing. The check runs after imports and codebook changes, every night, or when you click Run check now, and each project can switch it off. Codebook formulas are checked while you edit them, without blocking the save.
🧭 Quadrants and new templates: Scored surveys can place respondents in a four-field quadrant. Three templates use it: a data culture compass, a political compass, and a career orientation test built on the O*NET Interest Profiler items. Nine more templates cover hospitals, care homes, associations, dealer networks, utilities, municipal heat planning, and product teams. Scales with two poles, such as market and state, show no rank letters in the results.
📈 Improvements
⚡ Faster dashboards: Dashboards preload every chart and text block, visible ones first, so they don't wait for you to scroll. DataLion loads its chart and PDF libraries only on pages that need them, and project pages appear sooner as a result.
📤 Exports that keep the dashboard layout: PDF exports keep the dashboard's layout, PNG exports don't clip charts, and legends stay clear of the question and source line. SVG downloads keep the plot size, and PDFs of single charts show the whole chart card on one A4 page. Translated dashboards export in the selected language. Long exports show their progress in a card and say why if they fail. DataLion sends an email with a download link only when the project has switched it on under Admin → Projects → Settings → Reports.
🏷️ Long labels and full legends: For category labels and legends, choose between word wrap, Shorten with …, and a smaller font. Set the default under Admin → Projects → Design and change single charts under Labels. A legend with thirty entries stays readable, and horizontal bar labels don't overlap.
🔎 Search by field name: The search box in the left navigation finds questions and answer options by the field name from your data file. Each result shows its field name beside the label.
👥 Add viewers in one step: Under Add viewers in a report, administrators see every active workspace user. People without project access get it on save, with an access profile if you pick one. Previously this took a detour through user management.
🔒 Write protection and concurrent editing: Clicking the status badge in the project header turns write protection on or off, and the project name opens a project switcher with a search field. When two people save the same report, the second save no longer silently replaces the first person's changes. The second editor sees who saved and when, then discards their changes or overwrites on purpose.
🏠 Start page and quick tours: On the calmer start page, setup progress sits as a small ring in the top bar. Demo cards name the three features they show, and Continue lists six recently used projects and reports. Release news appears in German when the interface is German and in English otherwise. Guided tours have two to five steps and show only the controls a person may use.
📥 Imports that go through: Blank column headers in CSV and Excel files are named after their position, where the upload used to stop. Files with many long open-text columns and very wide files no longer fail to import. When multiple-response data and codebook disagree, two buttons under Admin → Projects → Codebook align them in either direction.
⚖️ Weighting: In the weighting expert settings, one button updates every stale target group weight at once. Weighted case numbers show as whole numbers in tooltips.
🔐 Sign-in and registration: The login page clearly separates password sign-in from signing in with Microsoft or Google. When you set a password, the page says which rule it doesn't meet, and invitation links stay valid longer. Registration refuses addresses whose domain cannot receive email, for example because of a typo. Signing up, building a first survey, and opening a first dashboard work on a phone.
🔐 Security
With 2026.2.198 you decide which operational data DataLion may collect. Under Admin → Trust Center → Telemetry, error diagnostics, customer care, usage statistics, and the optional product analytics are separate settings, each showing the service that receives the data. Product analytics is off by default and also requires consent. Every change is recorded in the security audit log, and these settings are locked while a DataLion support session is active. A master switch under Admin → AI turns the built-in AI features off, and while it is off, no data goes to an AI provider. It is on in the DataLion cloud and stays off on dedicated instances until an administrator turns it on. Every API token expires after 30, 90, or 365 days. Exports belong to the person who requested them: they stay available for 30 days and only reach the project's documents if someone files them with Save to Documents. Documents are visible only to the person who uploaded them until that person shares them with the project.
🐛 Important Bug Fixes
- Weighting: Weighted charts on projects with a weights table calculate correctly again. Raw column widgets and KPI tables weight their values, so weighted shares add up to 100 percent, including when weights use a base other than 1. Target groups and custom filters work for questions from additional data tables.
- Filters: Filter dropdowns stay open while a page or search loads, and jump to the first and last page again. Chart filters no longer send you to the start page, and resetting the filter row keeps default values. "Don't save time filters" applies when tabs are saved or renamed, and the "All" date range starts at the first data point.
- Charts: Charts with a benchmark load without errors, and chart settings open for charts that failed to load. Replacing groups from the chart data editor show up on multiple-choice questions, and low-base warnings sit in the right place.
- Surveys: New jump rules and display conditions survive autosave. Questions can be added again to surveys with explicit question codes, result cards keep their height, and matrix headers don't hyphenate short words.
- Exports: PowerPoint exports work for visitors of public projects. Excel exports of charts that show several questions separately work again, and PDF exports render header fills, bold text boxes, and timelines correctly.
- Import and codebook: Imports with long survey column names go through, and codebook imports leave no blank or duplicate text boxes. Questions without a field name read their option columns, and saved target groups keep the codebook's spelling of each variable.
- Interface: The Spanish, French, Italian, and Dutch interfaces show no raw translation keys. You can delete your own bookmarks again, and only your own.
Enjoy DataLion 2026.2.198. If you take your first questionnaire into the field in more than one language, we would love to hear how it went.