
Define a machine-readable Excel export
You can define a machine-readable Excel export for a report.
With this option you can either define the export format only, or also specify filters (= target groups) to be exported by default.
This option is currently available for the following chart types: columns, bars, stacked columns and bars
Procedure
-
Go to the report settings (gear icon to the left of the dashboards)
-
Under “Excel export settings” you can define the export format as machine-readable
-
To do so, write the following JSON into the corresponding field:
[{“machine_readable”: true, “metrics”: [“p”, “wn”], “filters”: [“f3956”, “f3957”]}]

-
Components of the definition
-
“machine:readable”: true → the Excel export of this report is run in the machine-readable format
-
“metrics”:[“p”,“wn”] → define which metrics of the charts are to be exported in the report.
p = percent, wn = weighted cases -
“filters”:[“f3956”, “f3957”] → define which of the filters you created are to be exported by default
Note: if a benchmark dashboard filter is defined on the dashboard, any filters selected there are exported in addition to the filters defined here. If only the filters selected in the dashboard should be exported, leave out the “filters” command at this point
-
Export format
Example: Value1 and Value2 were selected as filters/target groups in the benchmark filter. The dashboard contains the questions Question with Items and Dummy Question. The complete dashboard is exported.
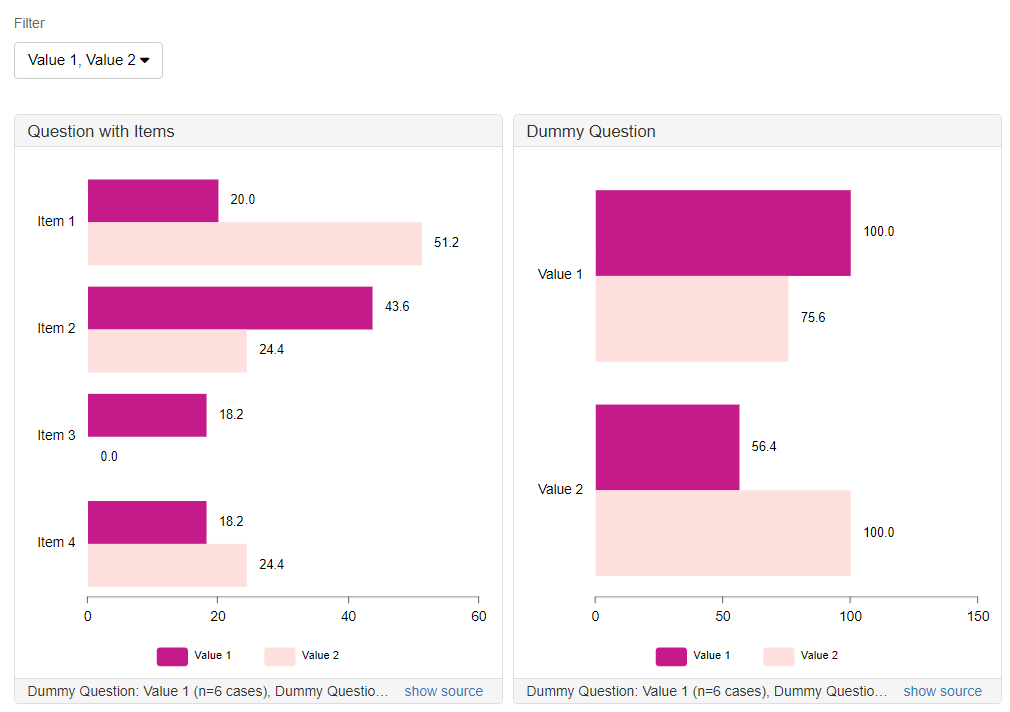
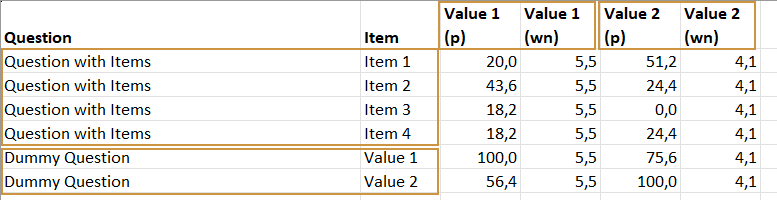
The Excel export contains the defined values for all charts on the exported dashboard (individual charts or the entire report can also be exported) and is structured as follows:
-
One row is created for each category (item) of a question.
-
For each target group (Value1 and Value2 in the screenshot), as many columns are created as there are metrics defined (percent and weighted cases = base of the question in the screenshot).
-
In contrast to the “normal” export, there are no empty rows, the question is repeated in every row, and the metrics are defined centrally instead of being taken from the charts.