
Create a predefined Excel export
An Excel export report is defined at project level under Excel reports.
Excel reports defined at project level can be released to one or more specific access profiles.
1. Define and release an Excel report at project level
-
In the project backend, go to the Excel-Reports tab.
-
Click Add new to insert a new field for the report definition.
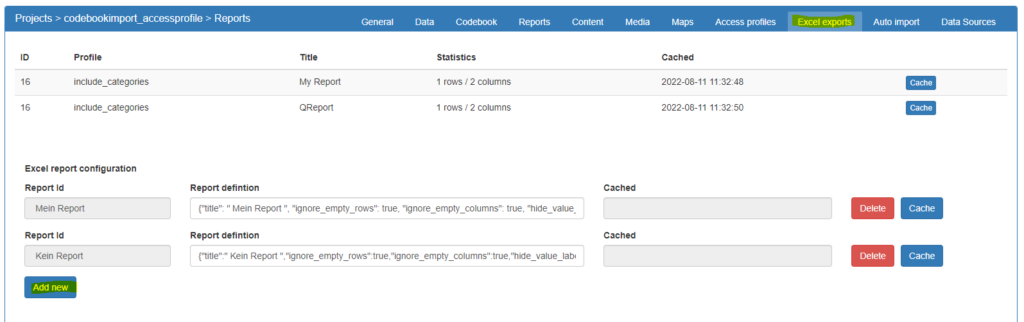
- In the Report definition field you can now insert the object containing the report definition. The code is written in curly brackets {}.
Enter the code here (without square brackets).
An example (explanation below):
{"title": "Unique report title1",
"ignore_empty_rows": true, "ignore_empty_columns": true, "hide_value_labels": true, "hide_variable_labels": false,
"filter": [],
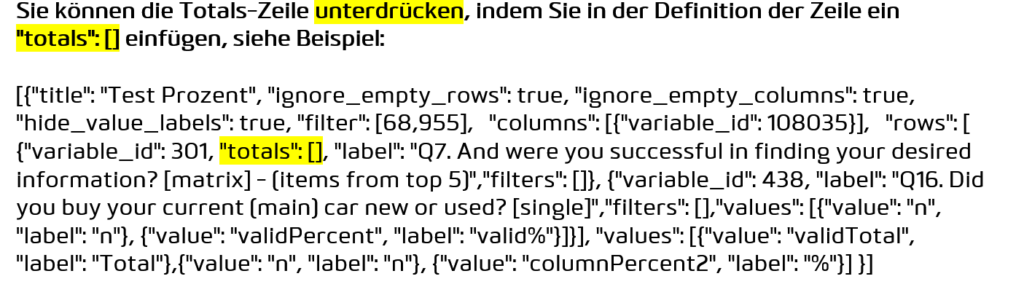
"totals": [{"value": "n", "label": "Total"}, {"value": "validTotal", "label": "Valid N"}, {"value": "mean", "label": "Mean"}],
"columns": [{"variable_id": 176 }],
"rows": [{"variable_id": 1},{ "variable_id": 109}],
"values": [
{"value": "n", "label": "n", "format": "0"},
{"value":"columnPercent", "label": "%", "format": "0.0%"},
{"value": "validPercent", "label": "valid%", "format": "0.0%"}] }
-
The system automatically assigns a report ID that corresponds to the report title (please note: the titles have to be unique. Several reports cannot share the same title).
-
To define another report, click Add new to insert a further field.
-
Save.
-
Now go to Access profiles in the project backend and open an access profile that should get access to the Excel reports.

- In the Excel Reports section of the access profile, tick “Allow access to these Excel reports” and select the report IDs of the reports you defined at project level. To select several reports, hold down the Ctrl/Cmd key and click on multiple reports.
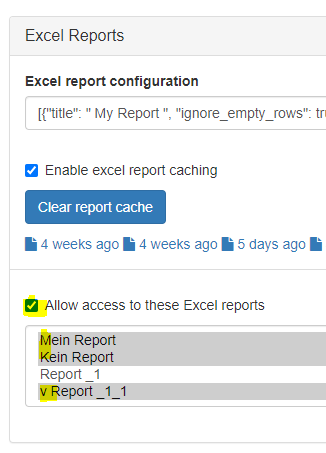
- Save. Users with this access profile can now access the Excel reports.
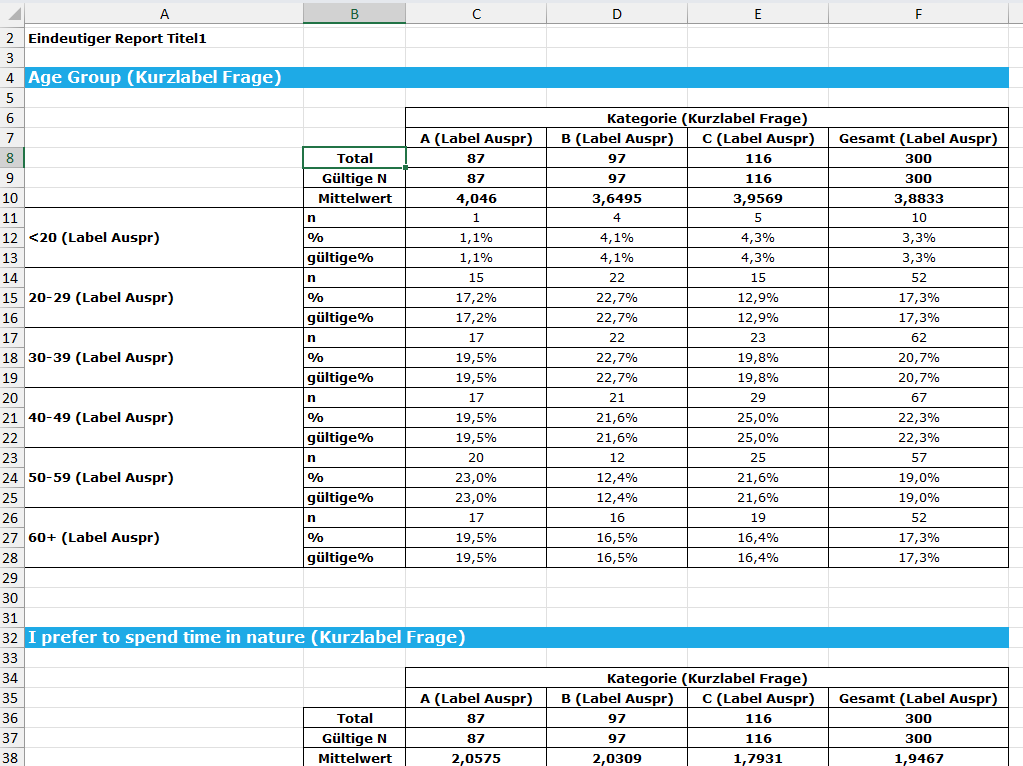
A possible Excel report:
Structure of the Excel report definition
In principle, the labels in the Excel report are taken from the codebook. The screenshot also indicates whether the label or the short label of the respective questions and categories is used.
Example:
{“title”: “Unique report title1”,
“ignore_empty_rows”: true,
“ignore_empty_columns”: true,
“hide_value_labels”: true,
“hide_variable_labels”: false,
“filter”: [],
“totals”: [{“value”: “n”, “label”: “Total”}, {“value”: “n”, “label”: “Total unweighted”},
{“value”: “validTotal”, “label”: “Valid N”}, {“value”: “mean”, “label”: “Mean”}],
“columns”: [{“variable_id”: 22740}],
“rows”: [{“variable_id”: 109}, {“variable_id”: 1}],
“values”: [{“value”: “n”, “label”: “n”, “format”: “0” }, {“value”: “columnPercent”, “label”: ”%”,
“format”: “0.0%”}, {“value”: “validPercent”, “label”: “valid%”, “format”: “0.0%”}] }
Explanation of the commands:
-
“title”: “Unique report title1” —> assign a unique report title
-
“ignore_empty_rows”: true —> if true: hide empty rows (= hide categories without values)
-
“ignore_empty_columns”: true —> if true: hide empty columns (= hide categories without values)
-
“hide_value_labels”: true —> if true: TBA
-
“hide_variable_labels”: false —> if true: the question label is hidden, only the labels of the categories are displayed
-
“filter”: [] —> no entry inside the square brackets = no global filter;
unique_id inside the brackets = global filter for the category of the specified
unique_id (e.g. “filter”: [3] filters all values down to the category with the id 3). -
“totals”: [{“value”: “n”, “label”: “Total”}, {“value”: “n”, “label”: “Total unweighted”, “weight”:false},
{“value”: “validTotal”, “label”: “Valid N”}, {“value”: “mean”, “label”: “Mean”,
“weight”:“variablename_weightvariable”}]
—> here you define which general values are output per column.
Available are: n (= number of cases), validTotal (= valid number of cases), mean (= mean value).
Case numbers can be output unweighted by adding “weight”:false.
By adding “weight”:“variablename_weightvariable”, case numbers and
means can be weighted with a weighting variable (variable name as in the data set). -
“columns”: [{ “variable_id”: 22740 }] —> defines which question(s) (or category/categories) are displayed in the columns (= definition of the column headers)
-
“rows”: [{“variable_id”: 109}, {“variable_id”: 1, “label”: “Custom label in the JSON - Age”, “filter”: [3]}],
—> defines which questions are displayed in the rows.
By adding “label”:“Desired label” you can set a label that differs from the codebook.
By adding “filter”:[unique_id] you can define pre-filters. -
“values”: [{“value”: “n”, “label”: “n”, “format”: “0” }, {“value”: “columnPercent”, “label”: ”%”,
“format”: “0.0%”}, {“value”: “validPercent”, “label”: “valid%”, “format”: “0.0%”}]
—> defines which metrics are displayed for the individual categories.
Available are: n (= number of cases), columnPercent (= column percentage), validPercent (= valid percentage).
For percentage values, the display can be adjusted by adding “format”: “0.0%” (with/without % sign & number of decimal places)
Examples: “format”: “0%” —> 10% | “format”: “0.000” —> 10.034 -
“label”: “A label for all questions (in the blue bar)” —> here you can define a label for all blue bars. To do so, simply insert the command before the last curly
bracket, separated from the previous content by a comma.
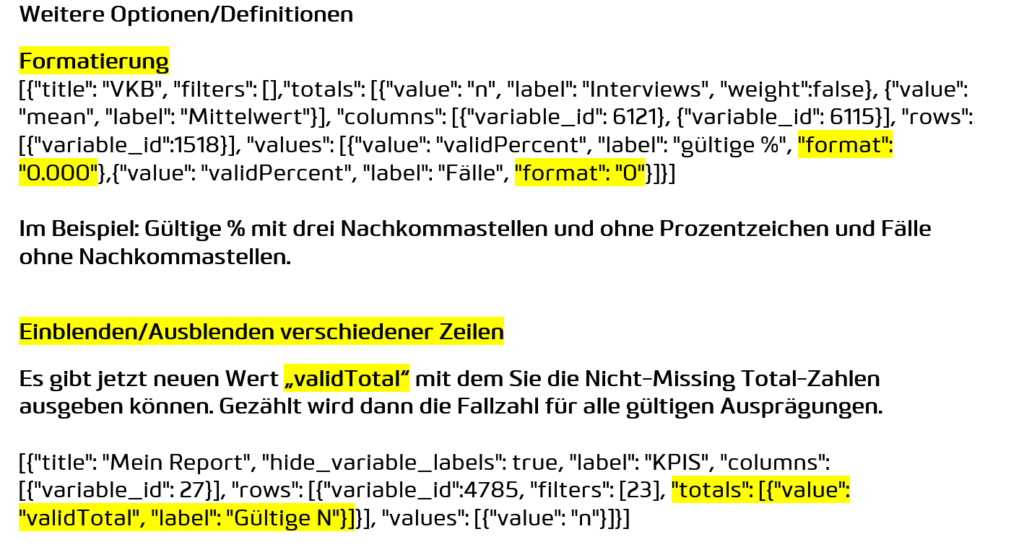
Further options [under review]:
You can validate the code here: JSON Formatter & Validator