
Visualizing multiple-choice answers
To visualize multiple-choice answers, you have two options in DataLion:
Option 1: One data column per possible category
-
Create one column per possible category in the data set (e.g. brand; coded 0/1).
-
Create an additional question in the codebook in which each codebook category (e.g. brand) is read from its respective data column (see the example below).
-
Alternatively, you can keep the automatically generated codebook without creating an additional question in it and work via the DataLion frontend instead. In the automatically generated codebook there is a separate question with two categories (1 = mentioned, 0 = not mentioned) for every data column, i.e. a separate question for every brand, for example. In the frontend, the individual questions are then dragged onto each other and combined (“merge”) via drag & drop. The categories for “not mentioned” can be deactivated via the interface.
Example
Data set:
In the data set there is one row per respondent and one column per possible category (here brand). The value “1” means that the brand was mentioned.
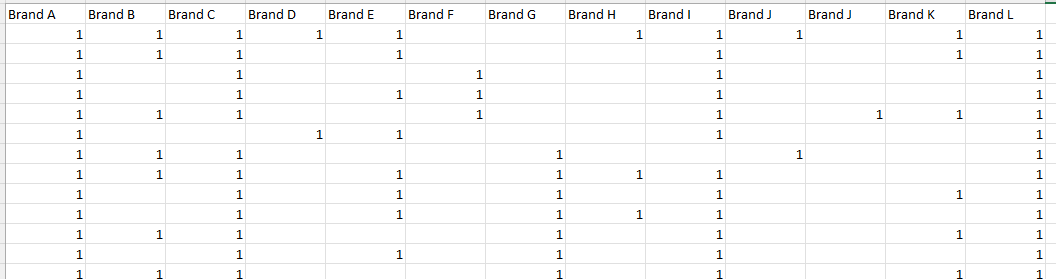
Brand A;Brand B;Brand C;Brand D;Brand E;Brand F;Brand G;Brand H;Brand I;Brand J;Brand J;Brand K;Brand L 1;1;1;1;1;;;1;1;1;;1;1 1;1;1;;1;;;;1;;;1;1 1;;1;;;1;;;1;;;;1 1;;1;;1;1;;;1;;;;1 1;1;1;;;1;;;1;;1;1;1 1;;;1;1;;;;1;;;;1 1;1;1;;;;1;;;1;;;1 1;1;1;;1;;1;1;1;;;;1 1;;1;;1;;1;;1;;;1;1 1;;1;;1;;1;1;1;;;;1
Codebook:
There is one codebook question with one category per brand. Each brand is read from its data column (see the codebook column “variable”). To query the mention, a “1” (= mentioned) is entered in the “value” column.
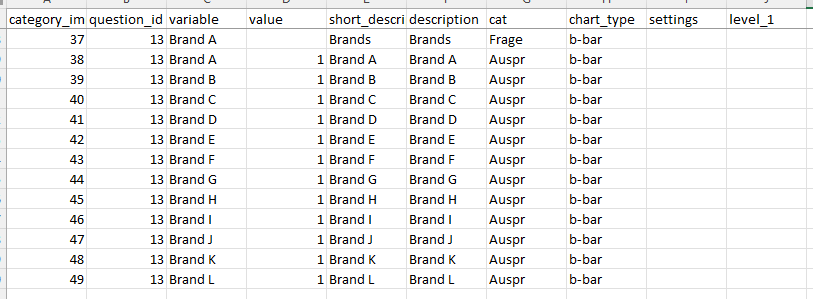
category_import_id;question_id;variable;value;short_description;description;cat;chart_type;settings;level_1 37;13;Brand A;;Brands;Brands;Frage;b-bar;; 38;13;Brand A;1;Brand A;Brand A;Auspr;b-bar;; 39;13;Brand B;1;Brand B;Brand B;Auspr;b-bar;; 40;13;Brand C;1;Brand C;Brand C;Auspr;b-bar;; 41;13;Brand D;1;Brand D;Brand D;Auspr;b-bar;; 42;13;Brand E;1;Brand E;Brand E;Auspr;b-bar;; 43;13;Brand F;1;Brand F;Brand F;Auspr;b-bar;; 44;13;Brand G;1;Brand G;Brand G;Auspr;b-bar;; 45;13;Brand H;1;Brand H;Brand H;Auspr;b-bar;; 46;13;Brand I;1;Brand I;Brand I;Auspr;b-bar;; 47;13;Brand J;1;Brand J;Brand J;Auspr;b-bar;;
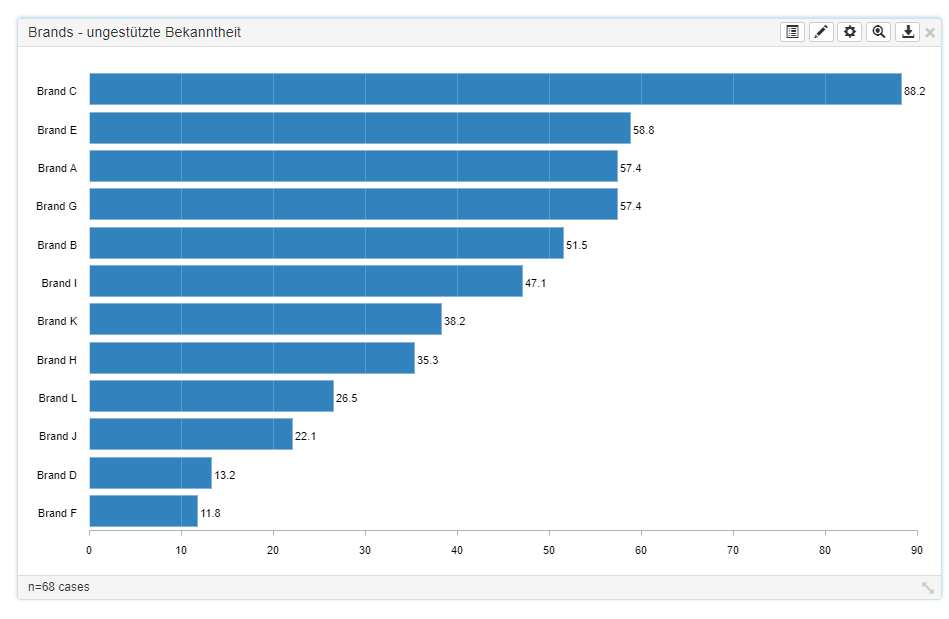
Result:
Option 2: One data column per mention
-
Create one column in the data set for each mention (1st mention, 2nd mention, 3rd mention, …). The columns contain the categories mentioned (e.g. brand A = 1, brand B = 2, brand C = 3, …).
-
In the codebook you then create a question in which each category reads the category from several columns using an OR combination. For brand B = 2, for example, the query ({{Nennung1 = 2 OR Nennung2 = 2 OR Nennung3 = 2}}) would return how often brand B was among the first three mentions.