
Developer Experience Survey (DevEx & DORA)
Measures development flow, friction points and the four DORA metrics via self-report – the basis for targeted engineering improvements.
The live demo opens the real questionnaire — no signup required.
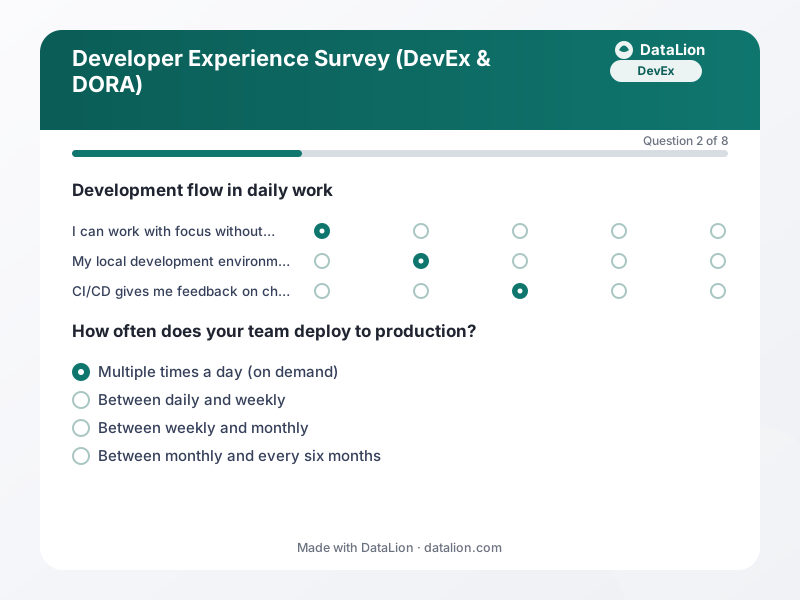
DORA research (DevOps Research and Assessment) showed that software delivery performance can be captured with four key metrics: deployment frequency, lead time, change failure rate and time to restore – and that the original research collects these via surveys, not tooling. This template combines exactly that with the newer DevEx approach: statements on flow, tooling, codebase and cognitive load show where friction arises, the four DORA questions provide benchmark anchors, and a friction ranking prioritises what your engineering team should tackle first. CI/CD telemetry can complement the picture later – developers' perception is the best starting point.
When should you use this template?
This template is a great fit for:
- Semi-annually as an engineering pulse with trends across waves
- Before investing in developer tooling or platform teams
- After major process or architecture changes
Every question in this template
- 1Matrix
Development flow in daily work
How much do the following statements apply to your daily work?
Strongly disagree Disagree Neutral Agree Strongly agree I can work with focus without constant interruptions. My local development environment is fast and reliable. CI/CD gives me feedback on changes quickly enough. Our codebase is understandable and easy to change. Documentation and internal resources actually help me. - 2Single choice
How often does your team deploy to production?
- Multiple times a day (on demand)
- Between daily and weekly
- Between weekly and monthly
- Between monthly and every six months
- Less often
- 3Single choice
How long does it typically take from committed code to running in production?
- Less than one hour
- Less than one day
- One day to one week
- One week to one month
- Longer than one month
- 4Single choice
How many of your changes cause problems in production (hotfix or rollback needed)?
- 0–15%
- 16–30%
- 31–45%
- More than 45%
- 5Single choice
How quickly is a production incident typically resolved?
- In less than one hour
- In less than one day
- One day to one week
- Longer than one week
- 6Ranking
What creates the most friction in your daily work?
Please rank the items – the biggest friction first.
- 1Slow builds and CI pipelines
- 2Flaky tests
- 3Unclear requirements
- 4Meetings and interruptions
- 5Technical debt
- 6Missing or outdated tooling
- 7Rating
Overall, how satisfied are you with your developer experience here?
- 8Long text
If you could change one thing about our development setup – what would it be?
From questionnaire to dashboard
The dashboard links DORA anchors to DevEx drivers – and shows where to invest:
- DORA tiles: Deployment frequency, lead time, change failure rate and time to restore as KPI tiles – directly comparable with the familiar elite/high/medium/low clusters from the DORA reports.
- Flow and friction profile: The flow matrix as diverging bars: what works (local environment? CI?) and what grinds (interruptions? docs?).
- Friction Pareto: The ranking of the biggest friction sources as sorted bars – the prioritisation for your platform or infrastructure backlog.
- DevEx trend: Overall satisfaction as a line across waves shows whether tooling investments actually reach developers.
- Team comparison: Flow statements crossed with teams as a heatmap – reveals whether friction is local (one team, one legacy system) or systemic.
- “One wish” analysis: The open question on the one improvement, clustered via AI topic analysis – usually the most concrete action list of the whole survey.
Related survey templates
- Psychosocial Risk Assessment (Workplace)Anonymous employee survey to fulfil the psychosocial risk assessment required under the German Occupational Safety Act (§5 ArbSchG), along the recognised GDA assessment areas.
- AI Literacy Assessment (EU AI Act Art. 4)Anonymous self-assessment of your employees' AI literacy – as a needs analysis and documentation basis for the training obligation under Article 4 of the EU AI Act.
- Psychological Safety in TeamsMeasures, following Amy Edmondson, whether team members can take risks, admit mistakes and voice concerns – the strongest known predictor of team performance.
- Recovery Experience (REQ)Four ways of refuelling after work: detachment, relaxation, mastery and control – shown as a profile across all four dimensions.
Frequently asked questions
Self-report instead of telemetry – isn't that inaccurate?
From what team size is the survey worthwhile?
How often should we measure?
Start with this template
Load the template into DataLion, adapt it to your brand and start collecting responses — GDPR-compliant, in minutes.